

Finding the right indicators – a collective stakeholder engagement approach
Charissa Ferrera, Namafe Namafe · | Environmental Report Cards | Science Communication | Applying Science | 1 commentsCharissa Ferrera and Namafe Namafe
After taking the first step in making the report card by looking at the bigger picture of things through conceptualization, we delved into choosing the right indicators for our reporting region. Our last class session was divided into three parts: (1) review of the major points during the previous class; (2) discussion of the assigned materials on "Step 2: What do we measure? Choosing indicators" and (3) participation of the class in a role-playing game called Brainwaves that spiced up the session!
1.Review of main talking points from the previous class
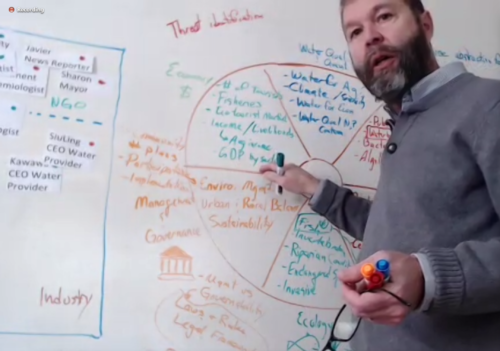
The recap of the previous lesson focused on the conceptualization techniques we learned - the stakeholder map, which identifies key stakeholders and their roles, and the word cloud. Bill explained that the quadrants of the stakeholder map were designed in such a way that both high interest and high influence (the champions and leaders) are found on the upper right-hand corner, because people tend to look up to the right when they are thinking about the future.
-
Dr. Heath Kelsey leading the class discussion. Photo credit: Vanessa Vargas-Nguyen
-
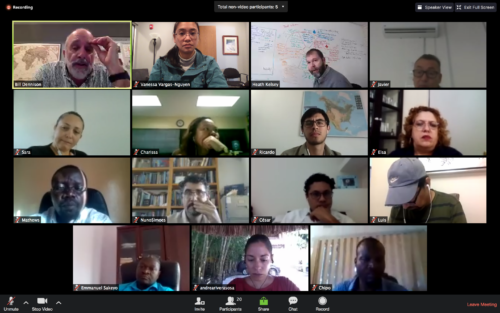
Screenshot of our third class session with participants from all over the world. Photo credit: Vanessa Vargas-Nguyen
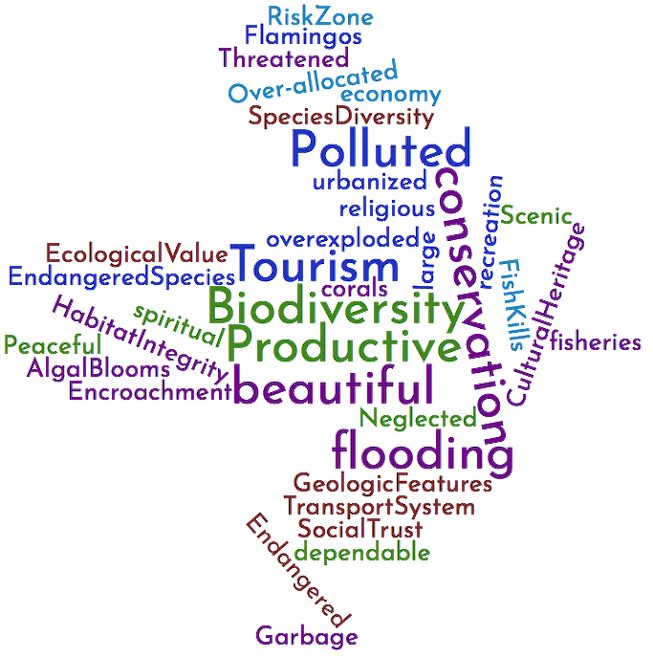
The matrix is also helpful in characterizing and prioritizing stakeholders. By knowing which quadrant each type of stakeholder belongs to, i.e. their level of interest and influence, we will be able to identify the appropriate proper approach to engage them throughout the report card making process (e.g. create interest, empower, or both). For example, the Champions can help in encouraging other stakeholders in becoming more involved in the process. We also took a second look at the word cloud generated using the three words that each of the members of the class submitted based on their individual study sites. Our that was generated was shaped as an arrow, which was somehow an encouraging sign for everyone to take the next step and move forward.
2.Selecting indicators
One of the big questions that we sought to explore and answer in this class was, "What is an indicator?". The oxford dictionary defines an indicator as a thing that is used to indicate the state or level of something. Through the lecture and readings, we learned that indicators are simply measurement tools that are used to describe the prevailing conditions of particular environments. These can either be qualitative or quantitative in nature and can be developed at various scales. Indicators are essential because they help bridge the gap between science and policy and influence decision makers who form the practices and policies that affect water resources planning and management (Bertule et al., 2017). Some of the features of a good indicator are outlined below.
-
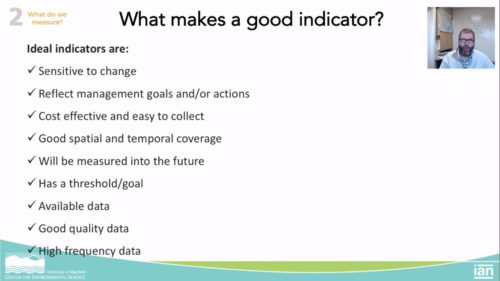
Features of a good indicator. Slide from Dr. Heath Kelsey's lecture on "Step 2: What do we measure? Choosing indicators".
We also learned that the selection of indicators may vary from region to region and this process is dictated by the values and threats identified in a particular area which may vary from catchment to catchment. Another vital to consideration is in selecting the appropriate number of indicators to avoid misrepresentation of current conditions in a catchment. Constanzo et al., (2017), states that having too many indicators may cloud interpretation and on the other hand, fewer indicators may result in inadequacies, which may potentially lead to erroneous conclusions and ill-advised policy decisions. It suffices to mention that either situations pose a risk to inadequate representation. Therefore, additional refinement is required to finalize the choice of indicators
-
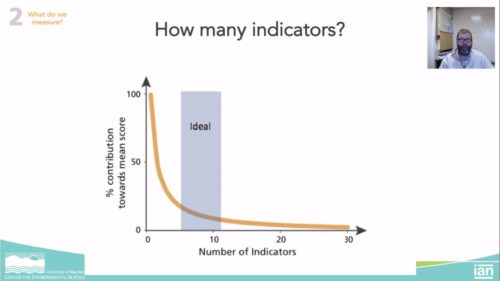
Recommendation for the ideal number of indicators. Slide from Dr. Heath Kelsey's lecture on "Step 2: What do we measure? Choosing indicators"
Questions on the reading and video materials were also raised, which were expertly answered by Bill, Heath and Vanessa. Some of the queries pertaining to the search for the right indicators were as follows:
- When no data is available for a chosen indicator. It is still important to include this indicator in the initial version of the report card. A gray area, which means no data, may be put in the report card to represent this missing information. Identification of missing critical information is an important part of the report card making process. Once these gaps are identified, then these can be used to justify the importance of future collection of this data.
-
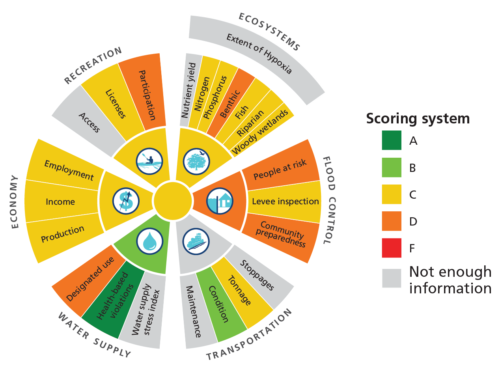
An example of addressing the presentation of insufficient data taken from the Mississippi Report Card. Photo credit: Costanzo et al., 2017. Practitioner's Guide to Developing River Basin Report Cards
- When data is available but not peer-reviewed or not well-documented. A related question to this is the validity of the data. The source of the data or "white paper" should be carefully examined. There are cases, such as in the Great Barrier Reef, where the coral health, seagrass, and water quality data were obtained by citizen science initiatives. In another case, trailer truck rentals were used as an indicator to study shifts in population from coastal to inland areas. Therefore, data should be fully documented, but not necessarily published.
- When there is possibility that the problem could be desensitized. In cases when facilitators are not from the region, some might view that they are not as invested in the area as that of concerned stakeholders. Therefore, it is really important to increase the interest and involvement of the people in the region. The key people should be identified. Sometimes these people are not necessarily year-round residents in the area (e.g. tourists and other "transients"). The approach to the problem depends largely on who is initiating the report card process and its purpose.
-
Recommended Indicator Categories of River Basin Health. Photo credit: Costanzo et al., 2017. Practitioner's Guide to Developing River Basin Report Cards
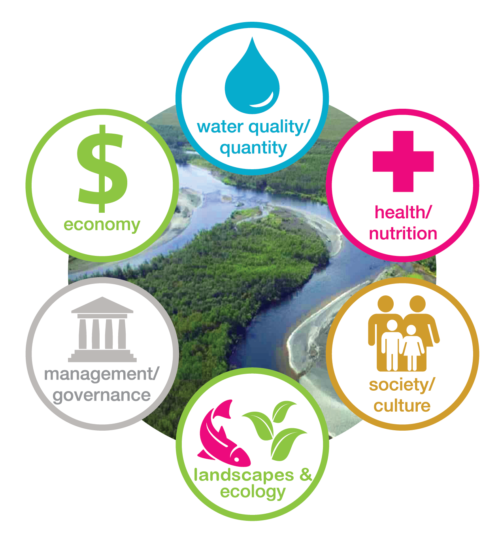
- On the flexibility of identifying indicators. The method used for identifying indicators was based on ecosystem services classifications for WWF for which there are six recommended categories (ecology, economy, management and governance, human health and nutrition, water quality and quantity, and society and culture). This has been proven to be a good model to use. In case of additional categories like that of the Mississippi catchment where values to do with transport where considered, it is recommended to assemble indicators depending on values and threats identified in the conceptualization stage. Categorization is therefore necessary in determining the scores.
- On drawing the balance in choosing indicators when crafting the story. It is good to have some constraints in choosing the indicators. The journey of a story was likened to an "And-But-Therefore" approach - capturing the values ("And") and threats ("But"), and identifying areas for restoration and protection ("Therefore"). It should be noted that a good report card is not just reporting on values but more importantly catalyzing environmental action initiatives.
3.The Brainwaves Game
During this brain streaming session, we were assigned roles to play as stakeholders in either Agristraat or Urbanland, two imaginary countries that share a transboundary river that is experiencing pollution, water shortage, and climate change problems.
-
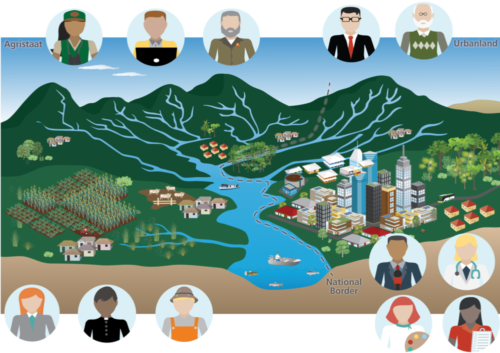
Image taken from PowerPoint presentation for the Brainwaves game showing the two imaginary countries of Agristraat and Urbanland. Image from Dr. Heath Kelsey
As a first step, we conducted a stakeholder mapping exercise, taking into consideration our assigned roles. The generated map showed a high level of interest for majority participants (we could not discount the fact that we're students of this course and are all interested on how to create a report card!).
-

Generated matrix following the stakeholder mapping exercise conducted by course participants. Photo credit: Dr. Heath Kelsey
We also identified the stakeholders that are not captured or represented in the activity, such as NGOs, local officials and farmers. The activity was fun as everyone had an opportunity to identify values and threats and select appropriate indicators in their assigned roles. The exercise allowed students to appreciate what really goes on in the processes of identifying values and threats as well as identifying accompanying indicators. The exercise revealed that during this process, sometimes tension occurs among different stakeholders and countries when matters of river basin problems are discussed. Students also came to appreciate that the process of selecting indicators is a critical step as this forms the start of the nitty-gritty details that will influence how the ecosystem will be scored, and how the story for the recovery of the river basin should be told. The result was an array of values, threats, and indicators carefully grouped into categories.
-
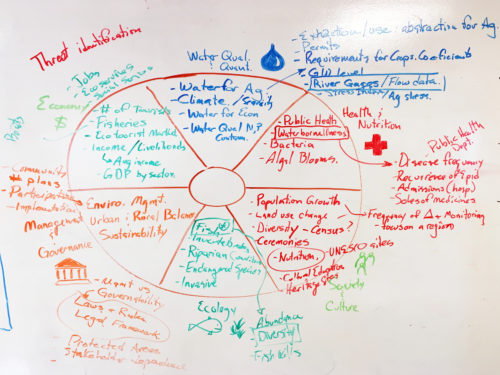
The resultant array of values, threats and indicators generated from students' submissions. Photo credit: Dr. Heath Kelsey
Before we end, perhaps one last point to remember based from this experience is that in times when internet connection is poor but stakeholder input is important, the use of the chat box option of the online meeting proved to be very helpful! Looking forward to learning with everyone again on the next class!
-
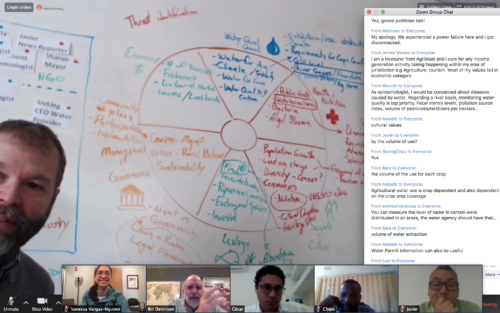
Application of the chat box function during our class. Photo Credit: Vanessa Vargas-Nguyen
References
- Bertule, M., Bjørnsen, P.K., Costanzo, S.D., Escurra, J., Freeman, S., Gallagher, L., Kelsey, R.H. and Vollmer, D. (2017). Using indicators for improved water resources management - guide for basin managers and practitioners. 82 pp. ISBN 978-87-90634-05-6.
- Costanzo, S.D., Blancard, C., Davidson, S., Dennison, W.C., Escurra, J., Freeman, S., Fries, A., Kelsey, R.H., Krchnak, K., Sherman, J., Thieme, M. Vargas-Nguyen, V. 2017. Practitioner's Guide to Developing River Basin Report Cards. IAN Press. Cambridge MD USA.
Next Post > Rupert and I Visit the Anthropocene
Comments
-
Ricardo Merlos 7 years ago
Choosing is not always an easy task, but selecting indicators is one of the most challenging activities for report cards, however SMART, SPICED and CREAM criteria for selecting good quality indicators are great guides for this job. Check chapter 3 of "Using indicators for improved water resources management"
Because all people needed to participate in this session, I liked writting down all our ideas on the chat box, it was more agile.