When to Go Big with Report Cards
Jodie Mehrtens ·Jodie Mehrtens
In the last of the lecture series for the IAN Healthy Rivers for All course we reviewed a number of report cards targeted for external and internal assessment and communication. What really impressed me was the sheer scale of some of the report cards. They cover some serious ground!
For example, the Chesapeake Bay Report Card covers a 11,601km2 with a drainage basin of 166,534 km2. The Orinoco River Basin Report Card on the Colombian portion of the 2,150km long Orinoco River. Its 981,446 km2 basin spans two countries (Colombia and Venezuela) before draining into the Atlantic Ocean. Stretching even further, the Great Barrier Reef Report Card covers more than 344,000 km2 of coastal reef systems and 35 adjacent catchment basins, which comprise a watershed of 424,000 km2 that drains directly into the Great Barrier Reef lagoon. Surely the queen of all report cards is the Mississippi River Watershed Report Card. Covering a watershed area of 3.2 million km2, the reporting region encompasses parts of 31 states.

The benefits of going big:
- Gain a broad reach
- Form a broader platform to have conversations about overarching catchment issues
- Identify areas where finer-scale monitoring and reporting are needed
The challenges of going big:
- Multiple stakeholders means multiple points of view, and it can be difficult to capture everyone’s values and interests
- Multi-lingual countries often means releasing report cards in two languages, without reducing impact or losing the message in translation
- Multiple layers of governance complicate stakeholder relationships, permitting, etc.
- Multiple values and threats necessitates a transparent process of prioritization to point out what the report card does and doesn’t do
But size isn’t everything...
There are many reasons to report at small spatial and temporal scales, and the reasons can vary:
- Closely target a specific area (e.g. a sub-basin, a harbour or a beach)
- Prioritize and track specific issues of local interest (e.g. drinking water, local fisheries)
- The initial budget for the report card may be small and starting with a smaller reporting region is a viable option
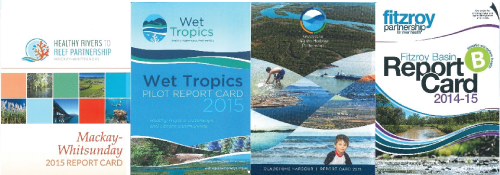
Arguably, the best of both worlds is when large-scale report cards are accompanied by a suite of smaller-scale report cards. For example, the Great Barrier Reef Report Card covers a large spatial area and reports against state and federal government water quality targets and best management practice uptake. Complimentary to the Reef Report Card is a series of finer spatial scale regional report cards, which are produced by partnerships that include members of government, research, industry, and local communities. The regional report cards fill the gaps in terms of reporting on finer scale ecosystem health, industry, and urban stewardship, and they also incorporate economic, social, and cultural indicators.

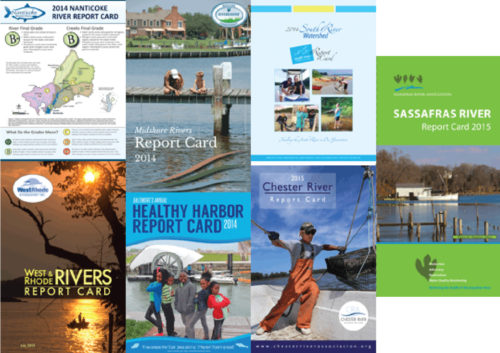
Similarly, the Chesapeake Bay Report Card provides an overview of Bay water quality and critical seagrass habitat, as well as a fisheries index. Complimentary to the Chesapeake Bay Report Card, there are many smaller-scale, community-lead assessments that address issues relevant at a more localized scale. The smaller-scale report cards are able to monitor and communicate local values and threats specific to their sub-basin or river catchments.

The increasing popularity and use of report cards, as well as their multi-year longevity, are testament to their effectiveness and their value at small and large scales. Regardless of the scale of a report card, a report card can have real environmental impact when the focus is on RAISING THE GRADE.
As a communication device, report cards are invaluable because they have the capacity to invoke real change when linked to social and management responses. For example, the release of the 2015 Mississippi River Watershed Report Card resulted in a press frenzy over the “C” grade, which many stakeholders found unacceptable. One outcome was that the ninth annual Upper Mississippi River Conference titled their conference “Raise the Grade” and took steps towards putting actions in place to improve the social, economic, and environmental conditions that lead to the unsatisfactory grade.
If you’re looking for a fun and interactive way to “Raise the Grade,” you could try the “Get the Grade” report card role playing board game! I played this at the 2017 River Symposium in Brisbane, and it was a real eye opener, allowing me the opportunity to have some surprising realizations when I stood in the shoes of an industry stakeholder. The "Get the Grade" game is a great way to learn or practice the report card development practice that we have discussed over the course of our class discussions, as well as to practice stakeholder engagement.
Next Post > Healthy Rivers for All: December 2017 retreat
Comments
-
Katya Altman 7 years ago
Jodie, I love your blog! The scale of the report card is a pressing issue for the project I'm working on in South Carolina as well. Thank you for including examples of the smaller-scale report cards, they're excellent references of regional work. I also liked the emphasis on raising the grade and achieving real environmental impact.
-
Chanda 7 years ago
Great blog as usual Jodie! Thanks for summarizing the pros and cons of the different scales so well.
-
maria 7 years ago
Thanks for this blog, Jodie!!!
Can i share this?
-
Irina 7 years ago
Thank you Jodie for another (!) very nice Blog! Liked and definitively would like to try the 'Get the Grade' game. It sounds fun and illustrative. We would need a version in Spanish though!...
-
Nancy Sheehan 7 years ago
Thanks Jodie for another great blog. As others catch the report card "bug" I hope that there will be more examples of smaller scale report cards linked with larger scale report cards. I am biased of course because my focus is on the smaller scale watershed. Thank you for included multiple examples of both types of report cards in your blog. Thanks also for a reminder about the "Raise the Grade" game. People learn more when having fun and interacting with others.

