How environmental report cards can democratize science
Bill Dennison · | Environmental Report Cards | Science Communication |This blog is part of the Basin Report Card Initiative: a partnership between the World Wildlife Fund (WWF) and the University of Maryland Center for Environmental Science (UMCES)
The word democracy has its origins in a Greek word from the 5th century B.C. Democracy is formed by combining "demos" meaning "the people" with "kratia" meaning "power". Literally translated as power by the people, democracy is the foundation of the modern western political systems. In order for the people to be informed, democracies insure that open channels of communication exist and that people can make informed decisions. Environmental report cards provide readily accessible, synthesized and interpreted information to a wide audience. Traditionally, scientists share their results with their colleagues through a peer review system of scientific publications. These scientific publications or journals generally have restricted access and are difficult to obtain outside of academic libraries. But environmental report cards provide a means of delivering accurate information in a timely manner to broad audiences.
In order to produce an environmental report card, various scientific experts are consulted in each region to help select indicators, determine thresholds and obtain data. Later in the process, these scientists help with the analysis and interpretation of the data. A consensus approach is used with the expert scientists so that the 'story' being developed is based on sound science. This rigorous scientific process is typical for scientists, but it is the next steps of consulting with resource managers and decision makers and widely communicating results that distinguishes this effort from the traditional scientific publication process. Report card results are published using non-technical language (often translated from English into local languages) and extensively supported with graphical elements like maps, photographs, diagrams and figures. The turnaround for the report card after reaching scientific consensus is rapid, usually within weeks or months. In contrast, the scientific publication process takes months to years from submission to publication. Most scientific journals have a prescribed format and are mostly text based, with sparse use of graphical elements.


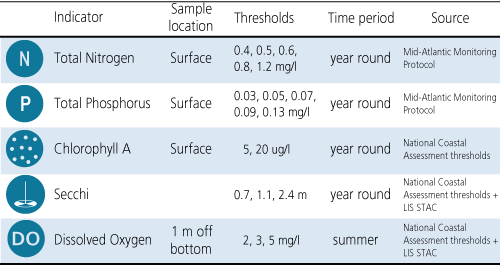
Every step in creating a report card involves a diversity of stakeholders. For example, we established the Long Island Sound reporting regions in consultation with the Citizen Advisory Committee of the Long Island Sound Study (LISS). When it came to selecting indicators, defining the period of the year to integrate measurements, the water depth of sampling, and the units and measurement techniques, this was done in successive consultations with the Science and Technical Advisory Committee of the LISS. The report card scoring, design and layout and color palette for the final product was done in consultation with the Long Island Sound Funders Collaborative along with key partners. Some of these transactions were painful for the Science Communicators making the multiple edits throughout the process (including the final days), but this democratic process produced a strong product on solid scientific footing that was effectively communicated to a broad audience.
One thing that we have learned from producing report cards around the world is that they usually receive extensive media coverage. This media coverage aids in the broad dissemination of results, which is important in a democratic process. It is not clear whether report cards produced in an authoritarian government system can have the same effect of democratizing science. It would be interesting to compare the effectiveness of report cards produced in democratic vs. authoritarian societies.

Ultimately, good science addresses fairly basic questions that can be phrased in a manner that is easily understood by a wide audience. The technologies and analyses employed to these basic questions are often very sophisticated and difficult to explain. But the answers to the questions can be phrased in the same manner that the original question is framed. In terms of environmental report cards, the basic question is "How healthy is your ecosystem?". A simple question that takes many people and many measurements to answer, but the answer can be equally simple using the report card scoring approach.
Democracy implies voting is occurring at some level. We often use voting to develop report card indicators. A case in point is the voting tool that IAN developed to use with the formation of Mississippi River indicators. Another way that votes are manifested are the various votes that are taken in local government planning commissions, zoning councils, and ultimately elected government positions that are affected by or informed by report cards. At the regional to national government levels, vote choices can be informed by the condition and management of iconic ecosystems (e.g., Florida Everglades, Great Barrier Reef, Chesapeake Bay).

Employing a stakeholder driven approach for developing report cards is a democratic process that attempts to solicit input from all sectors of the community. Democracy can be messy and loud at times, but it is an approach that creates the most robust results. When we ran report card workshops in India, we were impressed with the number of people talking simultaneously during our workshops. It seemed chaotic and unruly, but in the end it led to great products.

Winston Churchill's quote about democracies is relevant to report cards. Churchill said, "Democracy is the worst form of government, except for all the rest." Report cards are not perfect, but they are indeed better than other forms of scientific communication in that they a) provide a quick summary of the results, b) are readily understood by wide and diverse audiences, c) allow for more inquiry and investigation through indicator analysis, regional maps and trends over time, d) can catalyze better management and policy decisions in a democratic manner. So my version of the Churchill quote is the following "Report cards are the worst form of science communication, except for all the rest."
About the author
Bill Dennison

Dr. Bill Dennison is a Professor of Marine Science and Vice President for Science Application at the University of Maryland Center for Environmental Science.