

Your Not-So-Average "C+" 2021 Chesapeake & Watershed Report Card
Pheej Lauj (Pheng Lor) · | Environmental Report Cards |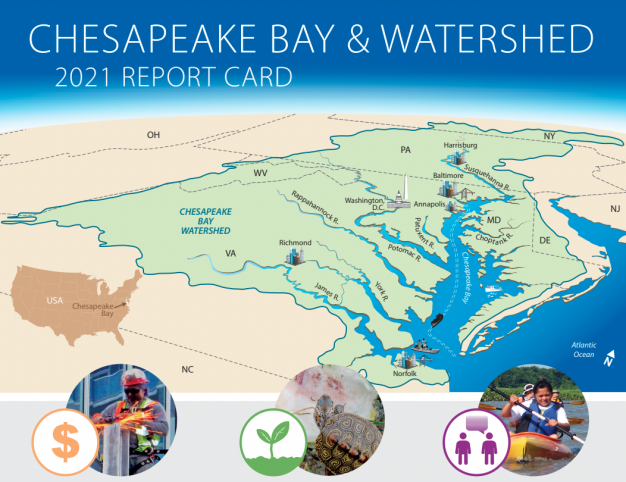
The 2021 Chesapeake & Watershed Report Card highlights unique findings in water and ecosystem quality compared to previous years. This year’s report stresses the importance of expanding how we make sense of the overall bay and watershed health as we start to look at economic and environmental justice indicators, such as: income inequality, housing affordability, social vulnerability to hazardous events, and walkability to parks.
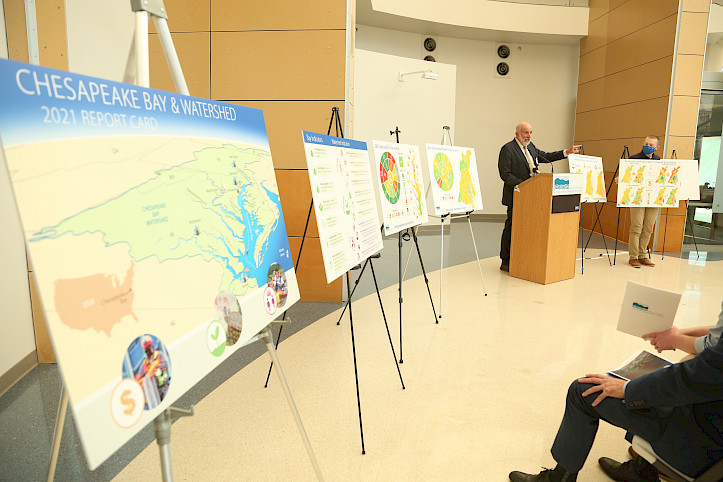
A gallery showcase of the 2021 Chesapeake Bay and Watershed Report Card as Dr. Bill Dennison announces Economic indicator findings. Photo by Nathan Miller.
The Chesapeake Bay is the largest estuary in the United States and is acclaimed as the second-largest in the world. The bay starts as far north as the Upper Bay to the James and Elizabeth Rivers, and stretches as far west as the Potomac River. From University of Maryland Center for Environmental Science (UMCES) President, Dr. Peter Goodwin, “the health of the Chesapeake Bay is a reflection of what is happening across its watershed, which includes six states and the District of Columbia and more than 18 million people.” The Chesapeake watershed spreads across the six states of Maryland, New York, Delaware, Virginia, West Virginia, and Pennsylvania.
This 2021 Chesapeake & Watershed Report Card commemorates its three-year release, expanding on the Chesapeake Bay Report Card’s environmental findings, which has been annually updated since its release year of 2007. The release of the report card took place on Monday, June 6, 2022, in Baltimore, MD at the Institute of Marine and Environmental Technology. This report card represents a transparent, timely, and geographically detailed assessment of the Chesapeake Bay and its Watershed.
New to this 2021 report card are economic and environmental justice indicators, which mark the start of a more holistic approach. Such indicators seek to better understand the health of the Bay beyond traditional ecological indicators which observe watershed health, such as trends of phosphorus, nitrogen, aquatic grasses, and other ecosystem health factors. This year’s report card includes economic data, in correspondence to ecological and societal data, allowing increased granularity in data representation on county, regional, and Bay-wide scales.
Watershed Health and Notable Regions:
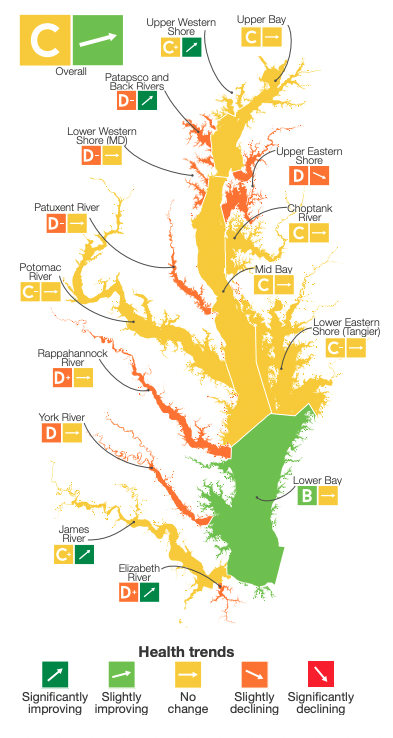
A color-coded map of the Chesapeake Bay with regional aggregated environmental quality grading and health trends. The map grades overall Bay Health a “C” grade associated with a rising arrow, indicating an improving trend. Image created by UMCES IAN staff.
This year's findings were of overall slight improvement since 2020, with the Chesapeake Bay watershed health scoring 50%, a C.
Ecological indicators encompass water quality, stream benthic community, and protected lands. Such bay indicators provide important aquatic vegetation and organism health factors necessary to measure ecosystem health and measure restoration trajectories.
Evident and crucial in annual report cards is an upward trajectory for watershed and ecosystem health. This year’s Bay health score of 50% is a 5-point increase from the 2020 score. In addition, 7 regions reported better water quality, aquatic grasses, and benthic community progress, resulting in improved grades. Despite a “C” grade for this year’s Bay and Watershed quality report card, the overall trend, referenced, indicates improvement.
In this year’s report card, the Patuxent River, as well as the Patapsco and Back Rivers both scored 23%, a D-. These were the lowest-scoring regions throughout the Bay. With Maryland Environmental Services (MES) oversight and recent investment in wastewater treatment plant upgrades, there is anticipated improvement in water quality. Furthermore, we also see a declining trend for watershed health in the Upper Eastern Shore which has not been observed in watershed health reporting since 2014.
For this report card, the Lower Bay was the highest-scoring region, consistent with previous years, and scored 65%, a B.
Bay health indicators help the research community, government, institutions, and public understand the status of the Chesapeake Bay. Furthermore, results of bay health indicators convey the importance of data collection and monitoring, ongoing support of efforts to improve watershed health and trajectory, and to expand these efforts where possible.
Integrating Environmental Justice, Economic, and Human Systems Indicators:
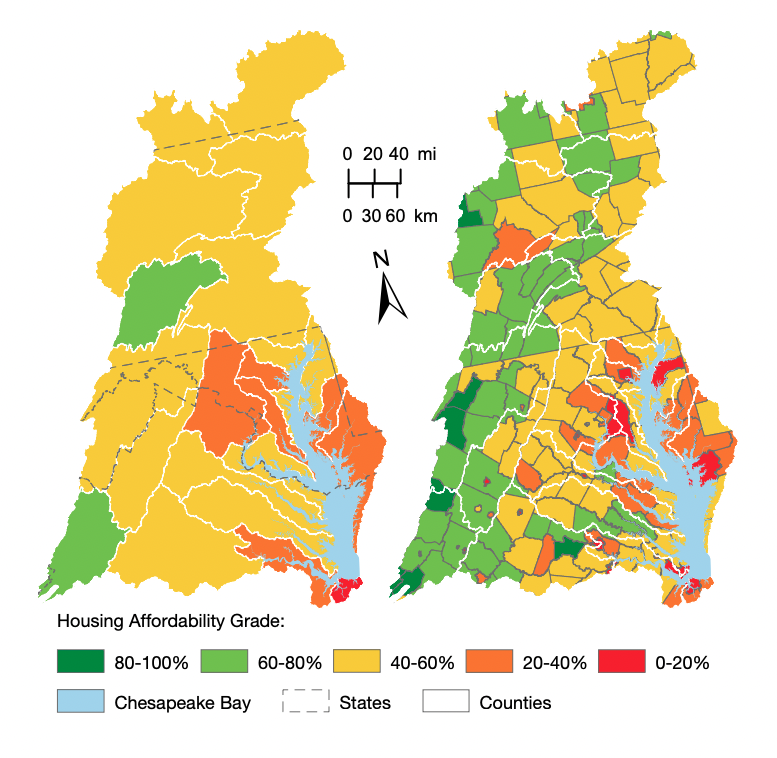
A color-coded map of the Chesapeake Bay and Watershed with aggregated county-level Housing Affordability data and grading (right) and population-weighted reporting regions (left). Image created by Joseph Edgerton.
In this year’s report card, the economic categories overall scored 51%, a “C” or moderate score. Similarly, the Societal categories scored 54%, also a moderate score. Accounting all economic, societal, and ecological indicators, the Chesapeake Bay and Watershed scored 56%, a C+.
Societal and economic indicators provide a more informed understanding of human and natural system impacts to the vast and complex watershed. Economic indicators included median household income, growth of jobs, income inequality, and housing affordability. Societal indicators of this watershed report card included stewardship, heat vulnerability, and social index, as well as walkability metrics. This report card year showed that most Societal categories scored a “C” or better, except for the Stewardship category, which received a “D.” Stewardship examines citizen stewardship in categories of behavior, volunteerism, and civic engagement sourced from the Chesapeake Bay Program’s stewardship index.
Fully embracing these indicators can help identify strengths and weaknesses in the approach to watershed best management practices. Measuring economic disparity, accessibility to the outdoors and the natural environment, as well as distribution of median household incomes can help identify the relationships between socioeconomic factors and environmental conditions, as well as strengthen strategies for effective stewardship education and engagement.
Findings for the 2021 report card Economic indicators are as followed:
- Median Household Income (traditional measure of economic health): 66%, a “B”
- Jobs Growth (measures net percentage of jobs gained or lost over the past 4 years): 48%, a “C”
- Income Inequality (measures income distribution): 49%, a “C”
- Housing Affordability (measures percentage of families spending more than 30% of their income on housing): 40%, a “C-”
A notable finding in the Housing Affordability map above indicates that a significant portion of the eastern shore and upper western shore of the Chesapeake Bay includes poor housing affordability and most southern regions of the bay, such as Norfolk and Virginia Beach, are categorized as very poor in housing affordability.
Economic indicators can also provide a fuller picture of communities that may be more or less vulnerable to climate change and impact. To better understand the Chesapeake Bay and Watershed, it is important to understand economic, societal, and human systems that are also main threads to solutions as we address the challenges of ecosystem and watershed health, climate change, and environmental injustice.
What’s Next?
A group image of Chesapeake Report Card cover poster and UMCES and Integration and Application Network staff, interns, fellows, and scholars. Photo by Nathan Miller.
This year’s report card has laid the foundations to expand our approach to organizing not only environmental and societal data to measure the quality of the Chesapeake Bay and Watershed, but also economic and environmental justice. Expanding economic and environmental justice indicators and looking at anthropogenic and human system correlation to environmental conditions, will help model best practices for natural resources management and protection, as well as foster effective collaboration and inclusion for everyone connected to the Chesapeake Bay and Watershed and beyond.
In the words of Congressman Dutch Ruppersberger, “I am proud to have secured vital federal resources that will help us move closer to the goalpost and bring home that A-plus rating we all desire. Today, we recommit ourselves to the health and prosperity of the Chesapeake Bay and all of the livelihoods it supports.”
We thank UMCES President, Dr. Peter Goodwin, and Vice President of Science Applications at UMCES, Dr. Bill Dennison for their leadership. At this conference, we were also joined by U.S. Representative Dutch Ruppersberger of Maryland, newly appointed Secretary Horacio Tablada of Maryland’s Department of the Environment of Maryland, Secretary Jeannie Haddaway-Riccio of Maryland’s Department of Natural Resources, and Jake Reilly, Director of Chesapeake Bay Programs with the National Fish and Wildlife Foundation.
We recognize indigenous and native people who originally occupied and tended to the land and waters of what we know today as the Chesapeake Bay Watershed. The Chesapeake Bay Watershed includes historic lands settled by the Accomack, Arrohatec, Chesoenhaka (Nottoway), Chesapeake, Cuttatawomen, Doeg, Ho-de-no-sau-nee-ga (Haudenosaunee), Kecoughtan, Kiskiack, Lənape Haki-nk (Lenni-Lenape), Lumbee, Manahoac, Massawomeck, Monacan, Nacotchtank (Anacostan), Nandtaughtacund, Nansemond, Nentego (Nanticoke), Occohannock, Onawmanient, Onöndowa'ga:' (Seneca), Pamunkey, Patawomeck, Piscataway, Pissaseck, Pocomoke, Powhatan, Quiyoughcohannock, Rappahannock, Sekakawon, Susguehannock, Warraskoyack, and Youghtanund.
References
- Back River WWTP. (2022). Maryland Department of the Environment. https://mde.maryland.gov/programs/water/Compliance/Pages/Back-River-WWTP.aspx
- About The Survey. (n.d.). Chesapeake Behavior Change. Retrieved June 13, 2022, from https://www.chesapeakebehaviorchange.org/about-the-survey
Integration and Application Network (IAN) Staff and Authors:
Dr. Bill Dennison, Vanessa Vargas-Nguyen, Sky Swanson, Annie Carew, Joe Edgerton, Heath Kelsey, Lili Badri, Lorena Villanueva-Almanza
Thank you for taking the time to learn more about the findings of the 2021 Chesapeake Bay and Watershed Report Card. We are thankful for readers like you and hope that you can play your part in helping the Chesapeake be a healthier and more robust ecosystem for everyone.
Learn more about our Coastal Ocean Assessment for Sustainability and Transformation (COAST Card) stakeholder-driven tool that monitors, forecasts, and reports the effectiveness of management decisions on coastal and ocean sustainability.
Developing the COAST Card tools in iconic locations (Chesapeake, Manila, and Tokyo Bays, Goa Coast) in both developed and developing nations will provide strong global models for future work. The development of the training program and launch of the interactive learning environment will enable other communities to emulate the COAST Card process, leading to a more sustainable future. You can learn more about COAST Card with this informational video.
Blog Written by: Pheej Lauj (Pheng Lor)

Pheej is a Global Sustainability Fellow and is working on the transnational Coastal Ocean Assessment for Sustainability and Transformation (COAST Card) project. Pheej’s background includes zero waste and plastics reduction advocacy, advancing climate and organizational equity, and multicultural engagement. He is a community educator and advocate, and has worked with low-income and first-generation youth and families as a TRIO college advisor and crew leader for the U.S. Forest Service and MobilizeGreen. Pheej earned his B.S. in Environmental Health and Equity at University of California, Berkeley, and is pursuing his M.S. in Environmental Humanities at the University of Utah.