IAN is committed to producing practical, user-centered communications that foster a better understanding of science and enable readers to pursue new opportunities in research, education, and environmental problem-solving. Our publications synthesize scientific findings using effective science communication techniques.

2020 Mississippi Rivers Report Card Methods (Page 1)

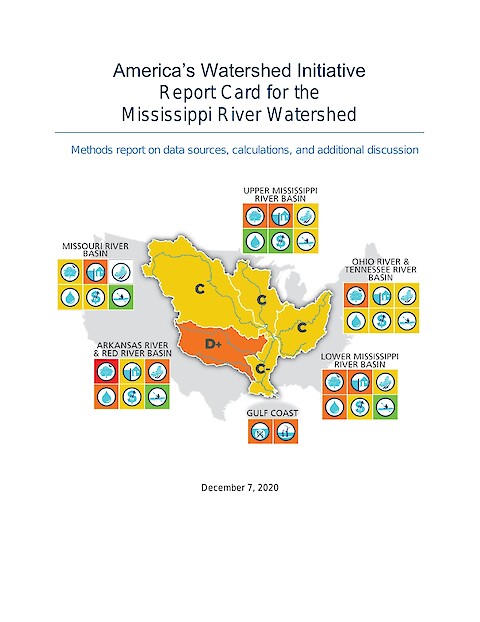
2020 Mississippi River Watershed Report Card Methods Document

Heath Kelsey, Katie May Laumann, Vanessa Vargas-Nguyen, Sky Swanson, Steven Guinn, Dylan Taillie, Joe Edgerton, Andrew Elmore, Jane Hawkey ·

This companion document to the 2020 Mississippi River report card contains information about data sources for all indicators, summary of analysis methods, and scoring details for each of the six America’s Watershed Initiative goals, and for two watershed wide indicators. Additional information regarding the goals is included to provide greater detail and discussion than is possible in the report card document.

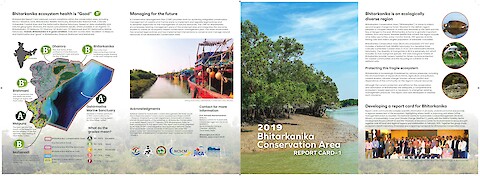
Coastal Georgia Ecosystem Report Card 2020 (Page 1)

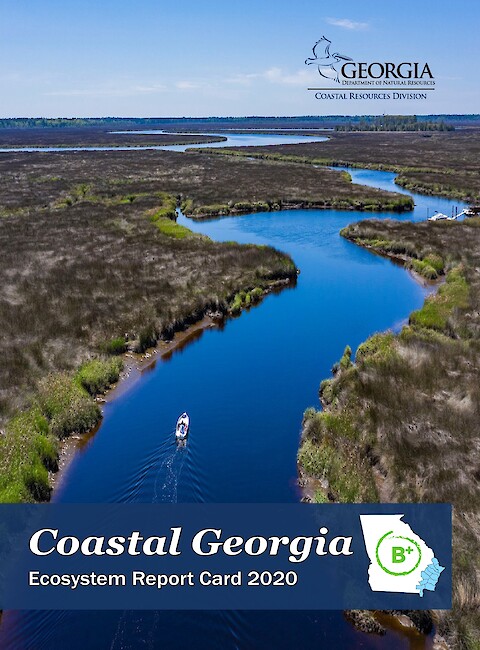
Coastal Georgia Ecosystem Report Card 2020

Alexandra Fries, Kelly Dobroski ·

This is the seventh Coastal Georgia Ecosystem Report Card. Georgia DNR has been creating report cards since 2014, when IAN helped kick off the process. This report card updates indicators and methods. New indicators added were dissolved oxygen, spotted seatrout, and bald eagles. Overall, Coastal Georgia received a score of 77%, a B+.

The Development Process and Methods for the Coastal Georgia Report Card (Page 1)

The Development Process and Methods for the Coastal Georgia Report Card

Alexandra Fries, Kelly Dobroski ·

This companion document to the 2020 Coastal Georgia report card contains information about data sources for all indicators, a summary of analysis methods, and scoring details. The values and threats to Coastal Georgia were revisited and indicator importance and relevance were reviewed. This led to the addition of three new indicators: dissolved oxygen, bald eagles, and spotted seatrout. The two indicators covering right whales (population and calves) were removed from the report card scoring.

Charting a Resilient Future for the Rio Grande (Page 1)

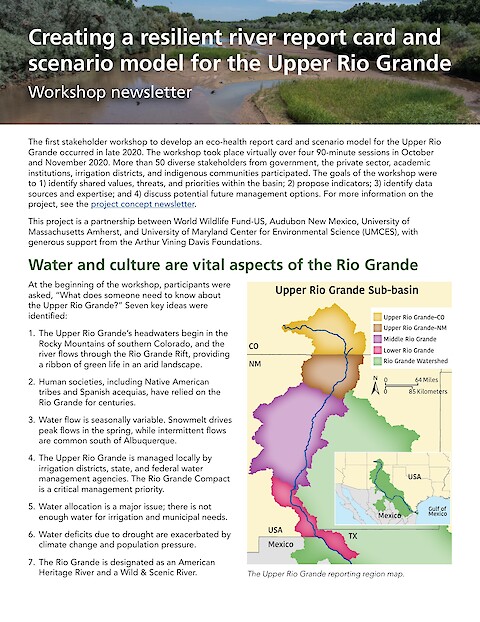
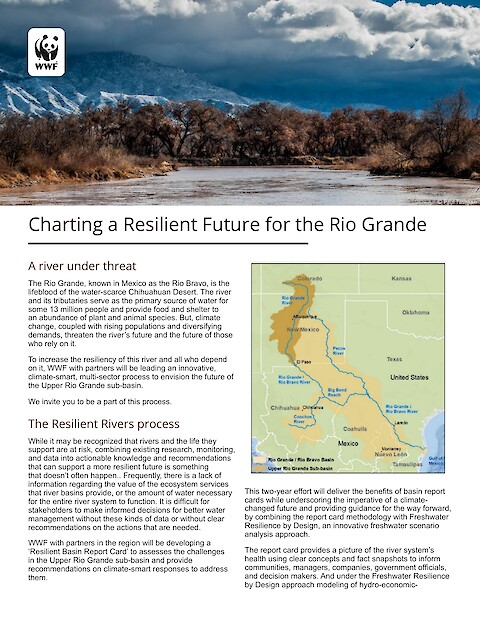
Charting a Resilient Future for the Rio Grande

WWF ·

This newsletter outlines the parameters of this project, designed to assess the socio-environmental health of the Rio Grande and offer management recommendations.

Chesapeake Monitoring Cooperative Achievement Report (Page 1)

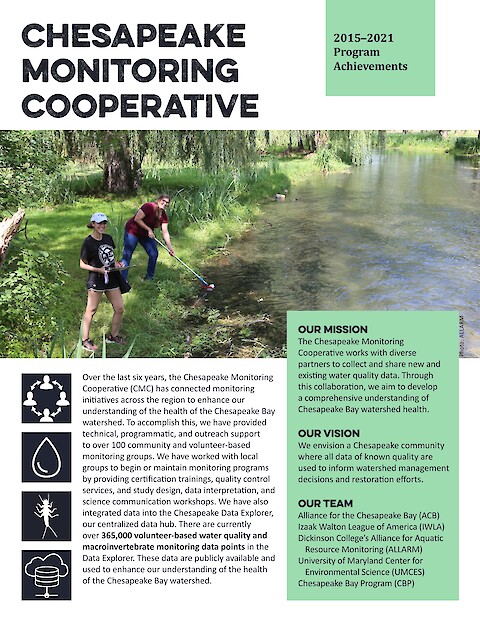
Chesapeake Monitoring Cooperative Achievement Report

Caroline Donovan ·

Over the last six years, the Chesapeake Monitoring Cooperative (CMC) has connected monitoring initiatives across the region to enhance our understanding of the health of the Chesapeake Bay watershed. Read more about how CMC accomplished this in our 7 page achievement report below.

An approach for decomposing river water-quality trends into different flow classes (Page 1)

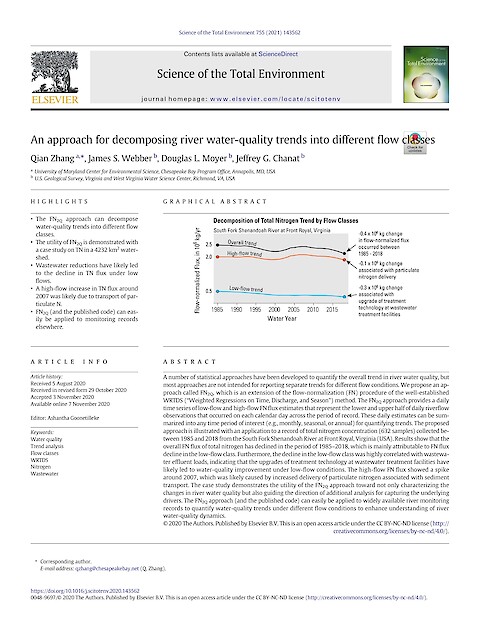
An approach for decomposing river water-quality trends into different flow classes

Zhang Q, Webber JS, Moyer DL, Chanat JG ·

A number of statistical approaches have been developed to quantify the overall trend in river water quality, but most approaches are not intended for reporting separate trends for different flow conditions. We propose an approach called FN2Q, which is an extension of the flow-normalization (FN) procedure of the well-established WRTDS (“Weighted Regressions on Time, Discharge, and Season”) method.

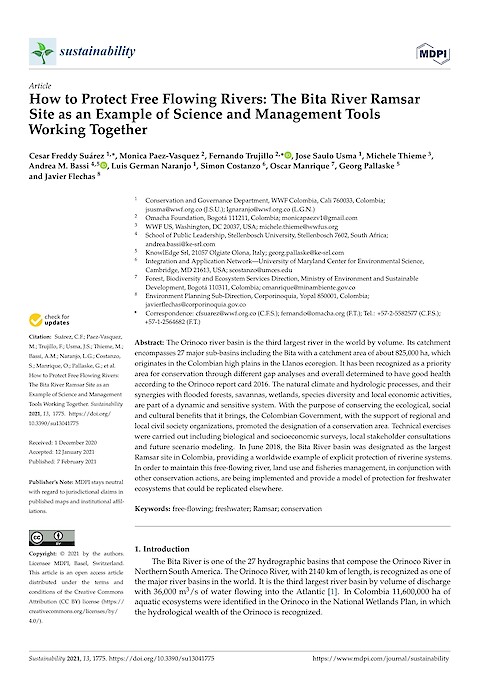
How to Protect Free Flowing Rivers: The Bita River Ramsar Site as an Example of Science and Management Tools Working Together (Page 1)

How to Protect Free Flowing Rivers: The Bita River Ramsar Site as an Example of Science and Management Tools Working Together

Suárez CF, Paez-Vasquez M, Trujillo F, Usma JS, Thieme M, Bassi AM, Naranjo LG, Costanzo S, Manrique O, Pallaske G, and Flechas J ·

The Orinoco river basin is the third largest river in the world by volume. Its catchment encompasses 27 major sub-basins including the Bita with a catchment area of about 825,000 ha, which originates in the Colombian high plains in the Llanos ecoregion.

Nutrient Trends and Drivers in the Chesapeake Bay Watershed (Page 1)

Nutrient trends and drivers in the Chesapeake Bay watershed

Hyer KE, Phillips SW, Ator SW, Moyer DL, Webber JS, Felver R, Keisman JL, McDonnell LA, Murphy R, Trentacoste EM, Zhang Q, Dennison WC, Swanson S, Walsh B, Hawkey J, Taillie D ·

The Chesapeake Bay Program maintains an extensive nontidal monitoring network, measuring nitrogen and phosphorus (nutrients) at more than 100 locations on rivers and streams in the watershed. Data from these locations are used by USGS to assess the ecosystem’s response to nutrient-reduction efforts.