IAN is committed to producing practical, user-centered communications that foster a better understanding of science and enable readers to pursue new opportunities in research, education, and environmental problem-solving. Our publications synthesize scientific findings using effective science communication techniques.
Orth RJ, Dennison WC, Wilcox DJ, Batiuk RA, Landry JB, Gurbisz C, Keisman J, Hannam M, Lefcheck JS, Murphy RR, Moore KA, Patrick CJ, Testa JM, Weller DE, Merrittj MF, Hobaugh P ·
Synthesizing large, complex data sets to inform resource managers towards effective environmental stewardship is a universal challenge. In Chesapeake Bay, a well-studied and intensively monitored estuary in North America, the challenge of synthesizing data on water quality and land use as factors related to a key habitat, submerged aquatic vegetation, was tackled by a team of scientists and resource managers operating at multiple levels of governance (state, federal).
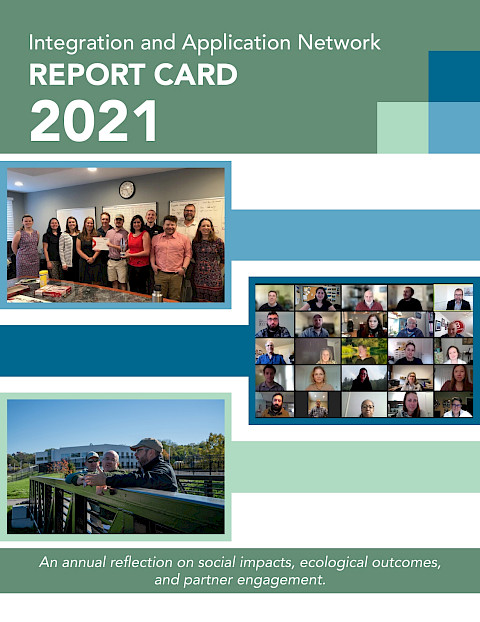
In the annual IAN Report Card, IAN staff reflect on accomplishments from 2021. The self-assessment is based on indicators in three categories: social impacts, ecological outcomes, and partner engagement. Overall, IAN received an overall grade of C+ (79%), a moderate score nearly in the good range.
This paper develops a barometer that indexes water quality in the Chesapeake Bay and summarizes quality over spatial regions and temporal periods. The barometer has a basis in risk assessment and hydrology, and is a function of three different metrics of water quality relative to numerical criteria: relative frequency of criterion attainment; magnitude of deviation from a numerical criterion; and duration of criterion attainment.
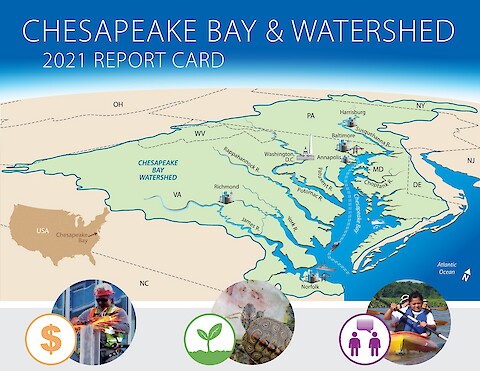
This report card provides a transparent, timely, and geographically detailed assessment of Chesapeake Bay and its Watershed. Since 2016, UMCES has engaged stakeholders throughout the watershed to transform the report card into an evaluation of the Chesapeake Watershed health. Watershed health includes traditional ecological indicators, but also economic and societal indicators. This is the third year the watershed has been scored, and four new economic indicators have been added.
The first-ever Cuando River Basin Report Card aims to assist in decision making to expand protected lands, increase biodiversity, maintain migration routes, and draw more tourists to the area. Inclusive conservation, which centers conservation actions on the needs of local communities, is at the heart of this approach.
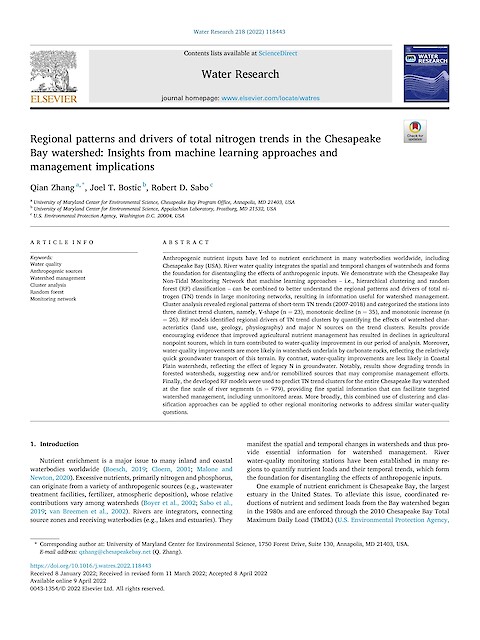
Sabo RD, Sullivan B, Wu C, Trentacoste E, Zhang Q, Shenk GW, Bhat G and Linker LC ·
Understanding drivers of water quality in local watersheds is the first step for implementing targeted restoration practices. Nutrient inventories can inform water quality management decisions by identifying shifts in nitrogen (N) and phosphorus (P) balances over space and time while also keeping track of the likely urban and agricultural point and nonpoint sources of pollution.
Canny A, Shahbol N, Thieme M, Fries A, Kelsey H, Costanzo S ·
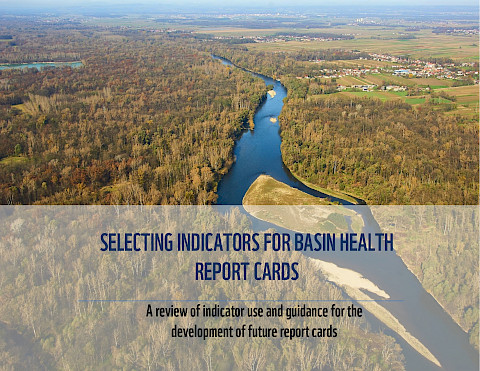
This Guide is developed to supplement the Practitioner’s Guide to Developing River Basin Report Cards, which was developed in partner with World Wildlife Fund (WWF) as part of the Healthy Rivers for All initiative. It is intended for those developing indicators that can help understand the health of a basin report card or those who are developing a basin report card.
Anthropogenic nutrient inputs have led to nutrient enrichment in many waterbodies worldwide, including Chesapeake Bay (USA). River water quality integrates the spatial and temporal changes of watersheds and forms the foundation for disentangling the effects of anthropogenic inputs.