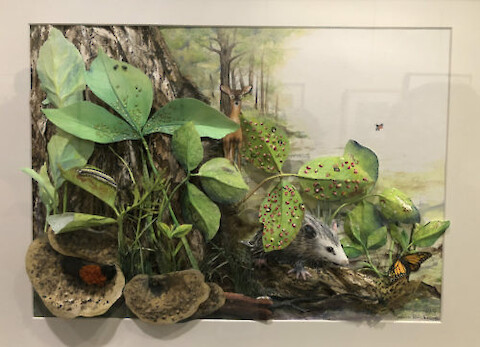
Scientific illustration is a beautiful form of science communication. The goal of scientific illustration is to accurately depict and teach scientific concepts. Illustrations can be created traditionally or digitally and are generally highly rendered – not to mention stunning – works of scientific art. These images are as informative as they are captivating. Insects and Opossum in Poison Ivy, by Robin Brickman.
It makes me cringe a little to remember the debriefing that followed our May workshop on the Everglades report card project. The IAN team was complimented for keeping the project on track. “Great job at herding cats,” they said, referring to our ability keeping a meeting of scientists on track. There was just one loose thread that needed to be tidied up. But, then the “cats” got hold of it, and for a moment it seemed that things might unravel.
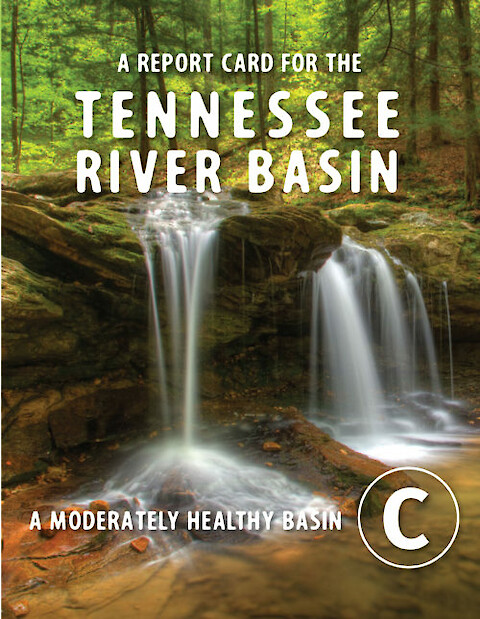
The Tennessee River Basin Report Card was released in February this year. It was made possible in large part because of feedback the IAN team solicited during the Tennessee River Basin Planning Network (TRBN) meeting in Chattanooga, Tennessee in August, 2017. Discussions we had at that meeting decided several issues related to the report card scope and detail that carried through to the finished product.
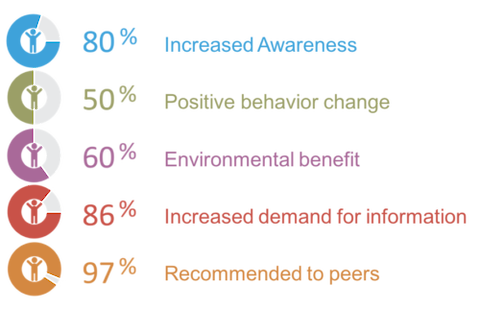
The Healthy Rivers for All Partnership spent some quality time last week brainstorming about how our report card projects are perceived. We take it for granted that the report card process increases engagement and leads to great outcomes. We talk about how great report cards are all the time, and we believe it! Positive outcomes are documented through a comprehensive survey of groups that have completed a report card process.
The first Yucatán Coast Report Card was released in April 2018, the culmination of almost 2 years of work by our colleagues at Laboratorio Nacional de Resiliencia Costera (LANRESC), in Sisal, Yucatán Mexico. The project kicked off with a stakeholder workshop that Jane Hawkey and I helped facilitate in August 2016. The long-term collaboration has made this report card release especially exciting.
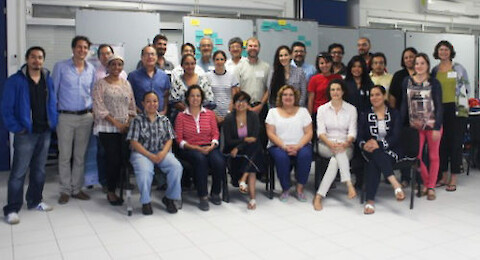
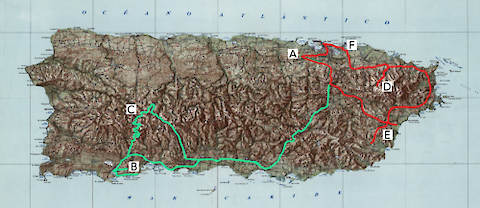
The Integration and Application Network has been involved in a series of workshops in partnership with U.S. Geological Survey to identify and communicate drought impacts across regions of the United States. The latest of this series took place in San Juan, Puerto Rico on May 30-31, focusing on vulnerabilities and draught-related issues specific to Puerto Rico and the US Virgin Islands.
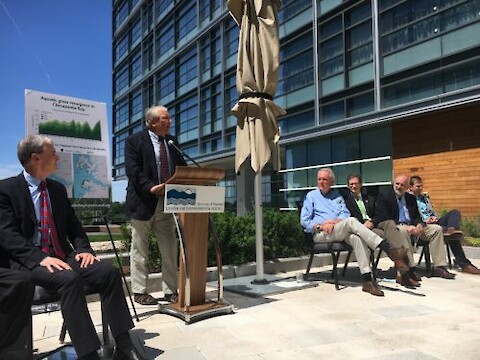
We held a press conference for the release of the 2017 Chesapeake Bay report card on 15 June 2018 on the Potomac River. We used the Hyatt Hotel as the press conference venue in a new development on the Wharf area of Washington, D.C. It was a great venue in that it showcased the social and economic opportunities that a clean waterway can afford. There were new water taxis plying the river, floating wetlands alongside a nice pier, and lots of restaurants and pubs along the waterfront.
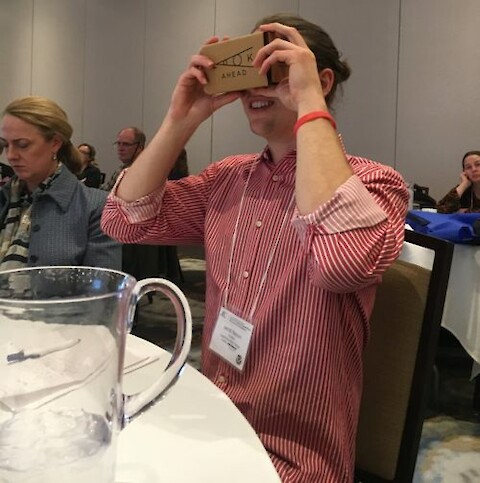
Towards the end of April and into the beginning of May, I took a trip up the East Coast to attend the 2018 Local Solutions: Eastern Climate Preparedness Conference in the city of Manchester, New Hampshire. The conference was one I had heard about somewhat serendipitously through the Bay Brief (a weekly newsletter produced by the Chesapeake Bay Program) and my mother around the same time.
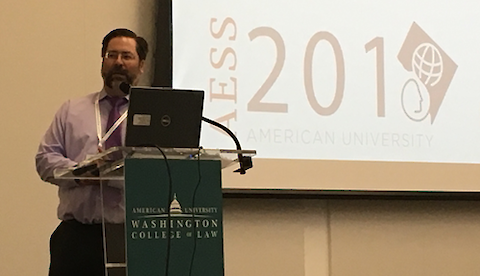
Last month I attended the Association for Environmental Studies and Sciences conference at American University in Washington, D.C. from June 20-23. This organization serves scholars who research and teach sustainability and other environmental issues through interdisciplinary lenses, and seeks to advance the "scholarship of science in service to society and the environment." The selected theme of "Inclusion and Legitimacy" was centralized in the conference discourse and culture.
I briefly summarized the workshop by highlighting the components of scale that were discussed in relation to island drought: spatial scale, temporal scale and complexity scale. In terms of spatial scale, we had discussions of global influences on island drought: El Niño/Southern Oscillation, North Atlantic Oscillation and Sahara dust storms.