EcoHealth Metrics for the Texas Coast Workshop
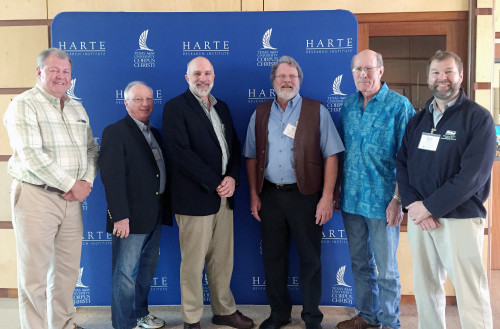
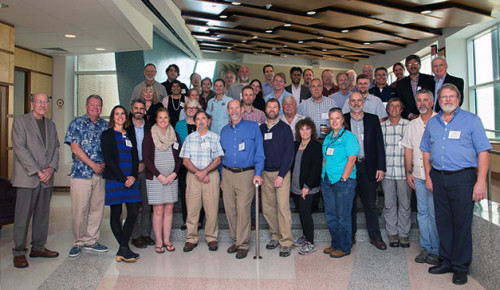
Heath Kelsey ·The long lost Gulf of Mexico Report Card project has been rekindled this week with a pilot project to create EcoHealth metrics for the Texas coast. We hope to scale this up to the rest of the Gulf next (including the parts in Mexico and Cuba). Bill Dennison and I traveled to Corpus Christi, Texas for a workshop to carry it forward, which was hosted by the Harte Research Institute for Gulf Studies at Texas A&M.

The original team consisted of Bill, Jane Thomas, and I from UMCES, Mark Harwell and John (Jack) Gentile from Harwell Gentile & Associates, and Larry McKinney and Wes Tunnel at the Harte Institute. In 2013, we created a vision document for a Gulf of Mexico Report Card with example indicators for pelicans and seagrass. Although it’s a few years old, it’s still a great document that provided us a framework to begin this process again.

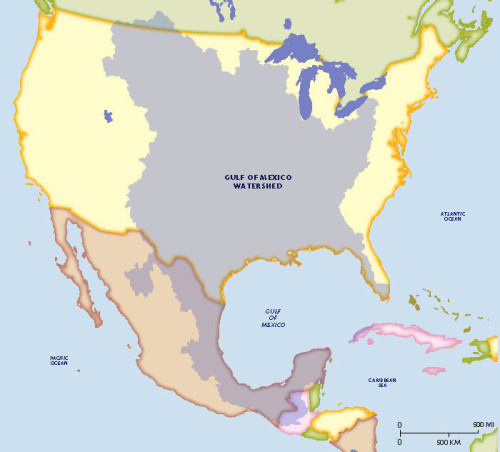
The Gulf of Mexico watershed is huge, including much of the continental United States, significant portions of Eastern Mexico, Guatemala, and Cuba. We hope to scale this Texas Pilot project to expand into all of these regions.
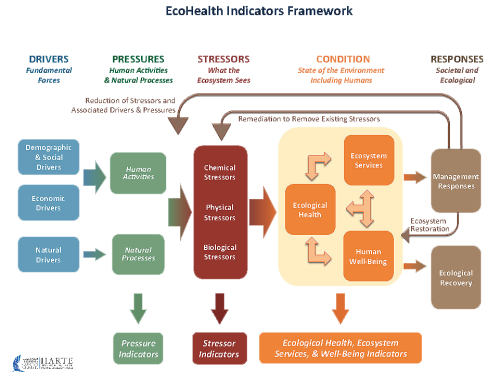
This workshop was organized and facilitated by Mark and Jack, who have developed a new conceptual model to connect ecosystem condition to stressors and pressures, and is designed to provide information to decision-makers on specific ways to improve ecosystem condition. This new model modifies previous ones called the DPSIR model (Drivers-Pressures-Stressors-Impact-Response). This new model is called the DPSCR4 model (Drivers-Pressures-Stressors-Condition-Responses (4)).
During the workshop, we identified key ecosystem services and features that society values, and the stressors that are influencing their condition. We put this into a matrix, which is designed to help identify the most influential stressors, and therefore the most important things to measure to evaluate stress to ecosystem condition.
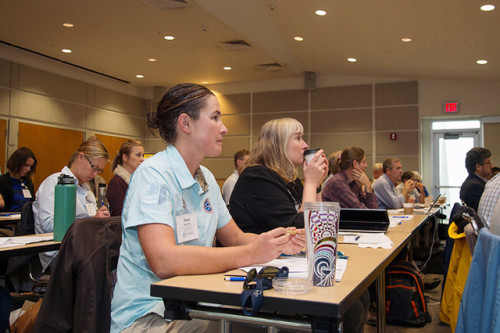
We did this for four groups of indicators related to Seagrass, Birds, Oysters, and Fisheries. At the end of Day 2, each group had completed the matrix and identified data sources for these measures. Next steps will be to identify data sources and compile data, finalize desired conditions, and begin to analyze it! In general, I was impressed with the ability of the folks in the room to identify relevant data sets and known target values to be used as desired conditions. Of course some groups have more extensive data to work with than others, but for the most part, they are a long way to completing their objectives.
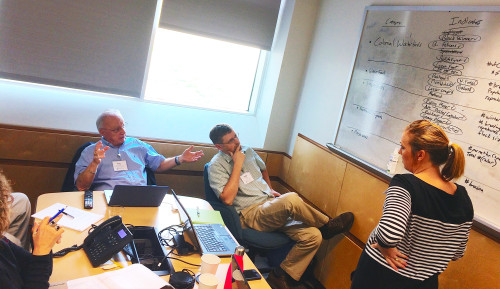
It was interesting being a participant in a workshop instead of a facilitator – Mark and Jack were in charge of this one, and it’s very different than the way we usually work. In this case, we started with the data and indicators – the bottom of the wedding cake – and thought about ways to aggregate up, using the DPSCR4 framework, and the stressors that act on the ecosystem features and services that we value as a society. Our style is usually to start with the top and work down, beginning with a conceptualization of key features and threats (stressors), then identifying indicators after that. In the end, we ended up with a good list of indicators that we’ll use to advance the Texas Coast Report Card Pilot!
About the author
Heath Kelsey

Heath Kelsey has been with IAN since 2009, as a Science Integrator, Program Manager, and as Director since 2019. His work focuses on helping communities become more engaged in socio-environmental decision making. He has over 10-years of experience in stakeholder engagement, environmental and public health assessment, indicator development, and science communication. He has led numerous ecosystem health and socio-environmental health report card projects globally, in Australia, India, the South Pacific, Africa, and throughout the US. Dr. Kelsey received his MSPH (2000) and PhD (2006) from The University of South Carolina Arnold School of Public Health. He is a graduate of St Mary’s College of Maryland (1988). He was also a Peace Corps Volunteer in Papua New Guinea from 1995-1998.

