Now What? Life After the Launch of a Report Card
Chanda Mwale ·Over the last few weeks, our Healthy Rivers for All class has been discussing the 5 step process of completing a report card. The class has now come almost full circle, and this week’s lecture was a discussion about life after a report card release. Our conversation started with a recap of Katya’s blog on project management and workshop planning, and included a discussion about the concept of design thinking and an overall appreciation of the role that a hybridization of art, technology, and science can play throughout the report card process.
There was consensus that a useful report card needs to extend beyond a wonderful launch party or press release. A report card often acts as a catalyst to gain support for improved ecosystem management, therefore it is very important that the post-launch lifespan is carefully considered. The report card is empowering and can lead to change depending upon the actions after the report card. To ensure that the report card is impactful after its launch, we can do two things: 1) Use convincing messaging and supply recommendations within the report card, and 2) use tools after the report card to catalyze further action.
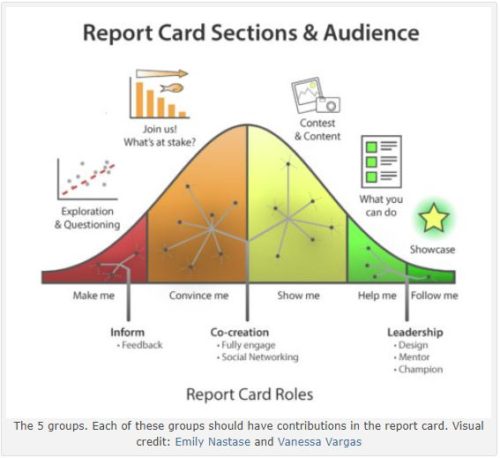
First, when developing a report card that will leave a lasting impact on society and the environment, it is important to consider multiple audiences. A blog by Heath Kelsey speaks of a report card role continuum of five different groups of stakeholders. As shown in the image below, these groups range from the “Follow Mes,” who naturally lead behavioral change for improved ecosystem health, to the “Make Mes,” who require a real push before becoming believers in the need to do something. The rationale is that each of these groups needs to be addressed in the report card, via strategic messaging techniques, in order to make sure that everyone hears the story in the report card. Different strokes for different folks—creating convincing messages and compelling recommendations is the name of the game here.

The second pathway to “postgrad” action is to use of one of the following three tools to help predict effects of different interventions in river basin systems: consensus approach, systems dynamic modelling, and social network analysis. Each of these tools are briefly explained below.
The consensus approach has been attempted in the Mississippi River, where a deliberate effort was made to identify how best to raise the grade for the river basin. Stakeholders shared what they believed was important in the basin and what could be done to improve those aspects. The interest was high and the collaboration was productive, resulting in an action agenda with discrete recommendations for decision makers; however, it is still not clear what will happen following the conference. The approach is collaborative and relatively simple but it could be argued that the tangible long-term impact of this approach is limited.
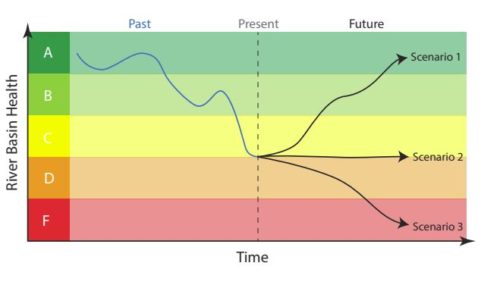
The systems dynamic modelling approach has been tried in collaboration with WWF and the Luc Hoffman Institute. This approach involves creating quantifiable, predictive models regarding future health of a basin, if intervention “x” were to be taken. For example, if a floodplain would be reconnected, what would be the outcome and effect on other ecosystem metrics? The potential scenarios could look similar to the image below.

The basis of the model is a causal loop diagram, created with stakeholder input. When the relationships in the causal loop are quantified it helps models predict what could happen when certain interventions are taken. The advantages of this approach are that it is very powerful for helping stakeholders to understand (and visualize) how the ecosystem works as a whole, highlighting the important leverage points. It is also quantifiable, predictive, and can convince skeptics as it is based on facts and figures science. A downside is that it is expensive, time-consuming, and requires very specific expertise. This approach has been tested on the Orinoco River and the Mekong.
Finally, social network analysis involves identifying both the defined goals for a basin and the relationships between stakeholders. When the actors working within a particular goal area are identified, this can give a good understanding of collaborations. This knowledge can be used to identify key actors and prioritize collaborators for collective action. Social network analysis is a very interactive method and can integrate tools such as SNAP, where stakeholders identify the values and threats of a system and then build up from there. The advantages of this approach include its abilities to evaluate linkages between stakeholders and unearth barriers to achieving change. Potential disadvantages are that it is often not quantifiable and it also requires expertise. There is hope that it will be tested in the Mississippi River in the near future in order to build upon the consensus approach previously used there.
Overall, the entire report card process is part of the buildup that can enable exciting and productive post-launch actions and processes, such as stakeholder mapping and prolonged engagement. Effective messaging during and after the report card process feeds into each of the above mentioned tools. Therefore, it is important to begin the report card process with a core idea of the need to raise the grade of an ecosystem, and then ensure that efforts are made along the way to guide the process towards an effective post-launch path, otherwise the report card could quite literally start and stop with nice launch events!
References:
1. Costanzo, S.D., Blancard, C., Davidson, S., Dennison, W.C., Escurra, J., Freeman, S., Fries, A., Kelsey, R.H., Krchnak, K., Sherman, J., Thieme, M. Vargas-Nguyen, V. (2017). Practitioner’s Guide to Developing River Basin Report Cards. IAN Press. Cambridge MD USA.
2. Kelsey, H. (2017). Evolving ecosystem health report cards to address issues of scale, acceptance, engagement, and behavior change. Retrieved on January 10th 2018 from /blog/evolving-ecosystem-health-report-cards-to-address-issues-of-scale-acceptance-engagement-and-behavior-change/.
Next Post > Using the Collaborative Learning framework to improve IAN’s report card development process and outcome
Comments
-
Irina 7 years ago
Chanda: congratulations for this very complete Blog. Loved the "life after the launch of a report card" expression! It is exactly what we are going to be experiencing in the next weeks after 18 months of "not-always-easy-collaborative" work on the Yucatan Coast Report Card! Irina
-
Nancy Sheehan 7 years ago
Chanda has encapsulated the purpose of creating report cards -- the improvement of ecological health. Chanda has emphasized the main points of last weeks session-- we cannot only focus on the launch of the report card but must think of how to integrate the report card process into our long term strategic planning to "raise the grade" of any one report card. Great job Chanda.
-
Katya Altman 7 years ago
Great synthesis of the information, and thank you for highlighting the need to keep the momentum going after the report card launch and listing the tools that can help to keep the audience engaged and the process going! Thanks, Chanda, for a fantastic job!
-
Ximena Celis 7 years ago
Very good blog and summary of the last sesión Chanda

