On 6 June 2023, we released the 2022 Chesapeake Bay Watershed report card along the shore of the Potomac River in Alexandria, VA. This was the first time that we released the annual Chesapeake report card in Virginia. Maryland Senator Chris Van Hollen was the featured speaker and he was joined by the Chesapeake Bay Program Associate Director Martha Shimkin, Virginia Department of Natural and Historic Resources Secretary Travis Voyles, Maryland Department of Natural Resources Secretary Josh Kurtz, Maryland Department of Environment Secretary Serena McIlwain, and Chesapeake Bay Commission Executive Director Anna Killius. These speakers were both eloquent and demonstrated their commitment to the Chesapeake Bay. They all mentioned how important it was that our report card has evolved to include social and economic factors and the environmental justice index.
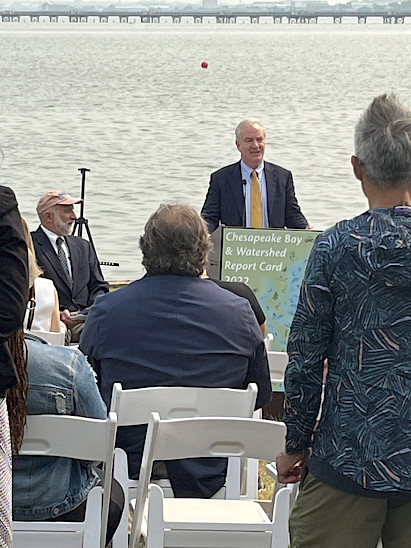
Maryland Senator Chris Van Hollen delivering remarks at the Chesapeake Bay Watershed report card launch in Alexandria, VA.Photo of Virginia Department of Natural and Historic Resources Secretary Travis Voyles (left) and Maryland Department of Natural Resources Secretary Josh Kurtz (right) at the report card launch.
My remarks were as follows:
This year marks the 40th year anniversary of the formation of the Chesapeake Bay Program. One of the signature achievements of the Chesapeake Bay Program was the establishment of an integrated monitoring program. This strong and robust monitoring program provides the data used in the Bay report card, and this year is the 16th annual Chesapeake Bay report card produced by the University of Maryland Center for Environmental Science. Since the Chesapeake Bay Program data set stretches back to the mid-1980s, we have been able to back-calculate the scores so that we can assess the trajectories of the scores. This year’s Chesapeake Bay score is an overall C, which is the grade it has received for the past twenty years. There is good news and bad news associated with this year’s Bay report card. The good news is that there is an overall improving trend, powered by the reductions in nutrients and the associated improvements in dissolved oxygen and the resurgence of aquatic grasses. The bad news is that there are tributaries on the Eastern Shore of Chesapeake Bay that are degrading. In order to better understand what is driving these improving and degrading scores, we have been embarking on a journey to develop watershed metrics over the past several years.
Photo of Maryland Department of Environment Secretary Serena McIlwain (left) and Deputy Secretary Suzanne Dorsey (right) at the report card launch.
And this year, we are releasing three separate report cards for the Chesapeake watershed. We have ecological, social, and economic watershed report cards, and they help us understand the factors that influence the health of the Bay.
We will start with the ecological watershed report card with an overall B- score. We have 4 indicators which are protected lands, water quality, stream benthic community, and fish communities for 23 reporting regions. The watershed ecological report card results directly relate to the problems that we are seeing in Eastern Shore tributaries in the Bay card. The relatively high scores in the headwaters along the Appalachian mountains also emphasize that it is land activities in our urban and agricultural sectors that serve to degrade the Bay.
The social report card which overall was a C has 4 indicators; stewardship, walkability, heat vulnerability, and a social vulnerability index. The moderate societal conditions across the watershed need improvement, with none of the 23 reporting regions in good status. The Eastern Shore once again scored poorly, which is a recurring pattern in all three watershed report cards.
The economic report card was also a C overall and the 4 indicators are housing affordability, income inequality, median income, and jobs growth. These report card scores are calculated at the county level, so there are 197 reporting regions. Watershed-wide, income levels were counter-balanced by housing affordability. Regions with high incomes tended to have less affordable housing. It is important to note that the Eastern Shore economic metrics did not score well—pointing out that environmental degradation is not simply a trade-off with economic development—we need more holistic approaches to create healthy communities that will result in a healthy Chesapeake Bay.
For the past several years, we have been developing indicators that reflect the environmental justice aspects in the Chesapeake watershed. This year, we are very excited to be working with the Centers for Disease Control and Prevention and Agency for Toxic Substances and Disease Registry, using their recently released Environmental Justice Index. The EJ index is calculated by assessing the social vulnerability, environmental burden, and health vulnerability at the census track level. As a result, we can now view a map of the EJ index for the Chesapeake watershed with over 4,000 report regions. The map shows strong disparities throughout the watershed. We can see the disadvantaged communities in urban areas in Norfolk, VA; Richmond, VA; Washington, DC; and Baltimore, MD. We can also see the rural regions in all 6 states with poor EJ index scores including Appalachia and the Eastern Shore. Clearly, we need Chesapeake restoration efforts to help resolve these disparities so that we have healthy communities throughout our watershed to help us achieve our shared vision for a healthy Chesapeake Bay.
Our annual Chesapeake report card serves as a global model. We are working with colleagues from the Philippines, Japan, India, and Norway to develop report cards in Manila Bay, Tokyo Bay, Ishigaki Island, and the Goa coast of India. Today, our colleague from the University of Bergen Norway, Dr. Aklilu Tadesse is joining us. In addition, we are hosting 6 Global Sustainability Scholars from all over the United States, supported by the US National Science Foundation and I would like to introduce Anna Calderón, Emma Gee, Darion Fredericks, Kameryn Overton, and Tre’nard Morgan. And immediately following the report card release, these scholars, aided by Integration and Application Network Science Communicators will be holding a stakeholder listening session here under the tents so that we can co-develop future iterations of the Chesapeake report card with stakeholder input. In addition to today’s listening session, we will be holding additional sessions in Maryland and Virginia over the next few weeks.
The annual report card effort is spearheaded by Dr. Vanessa Vargas-Nguyen, who also is the coordinator of our international effort in our Coastal Ocean Assessment for Sustainability and Transformation project that we call COAST Card. As part of the COAST Card project, we are developing a more detailed Potomac River report card to combine with a system dynamic model and social network analysis.
Dr. Heath Kelsey, Director of the Integration and Application Network, leads a dynamic team of Science Communicators and Science Integrators who work to engage diverse stakeholders, develop high-quality science communication products, and co-develop report cards around the world. Many of the IAN team contributed to the considerable data analyses and map creation that resulted in the report card you see here today. I would like to call out one of the IAN Science Communicators Sidney Anderson for her quite creative cover design.
At the University of Maryland Center for Environmental Science, we are nearing our 100-year anniversary. We have been using science to inform management and policy over this entire history, but now we are excited to be embarking on an effort to create a Chesapeake Global Collaboratory to combine the best science coupled with the best science communication to tackle the most vexing and challenging socio-environmental issues facing our society. We want to develop new tools with existing and new partners while bringing new voices into the conversation to co-create solutions to these grand challenges. In short, we want to find ways to improve the report card scores.
I also mentioned in an off-script comment that I was sorry to not have the late Dr. Beth McGee from the Chesapeake Bay Foundation in the audience, as she usually attended our report card releases. I thanked Chesapeake Bay Foundation President and CEO Hilary Harp Falk for attending and offered my condolences about the recent loss of Beth—a very special person in the Chesapeake restoration journey.
Mike Smith from GreenSmith, assisted by Dave Nemazie and Amy Pelsinsky from the University of Maryland Center for Environmental Science, worked their usual magic in obtaining extensive media coverage—the most we have achieved for the Chesapeake report card.
Dr. Bill Dennison is a Professor of Marine Science and Vice President for Science Application at the University of Maryland Center for Environmental Science.