The Swan-Canning River is the estuary adjacent to Perth, the capital of Western Australia, and its seaport, Fremantle at the mouth. The Swan is famous for its iconic black swans and has dolphins that regularly swim up to the foreshore of the central business district of Perth. It supports seagrasses (black swan food), prawns and fish, but has some severe water quality problems.
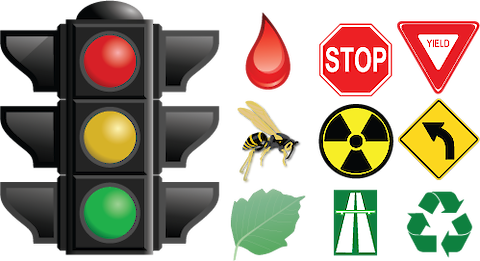
The use of red, yellow and green for denoting different levels of concern in environmental report cards has its origin in human perceptions of color. The color red is associated with blood and fire, which are instinctively perceived as 'danger'. Red is classified as a 'warm' color and infrared light is essentially heat. The color yellow is associated with warning, like a wasp with its yellow and black bands. The color green is associated with healthy vegetation, like tree leaves or grass.
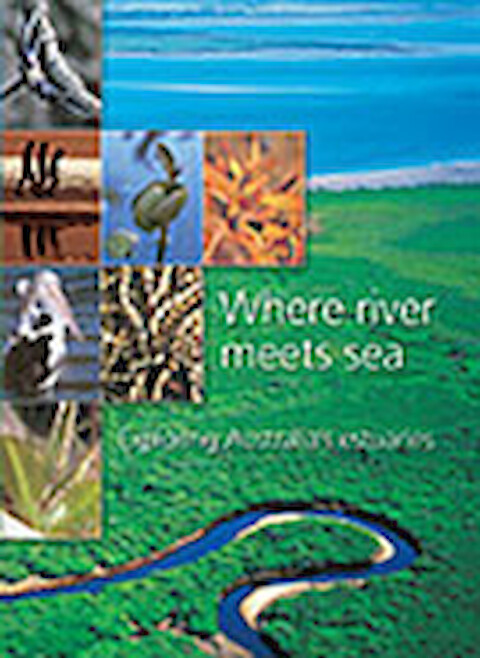
I had the opportunity to catch up with Steven Walker, the Executive Dean of the newly formed Faculty of Science at the University of Queensland. Years ago, Steven and I worked on an interesting project which was to assess the health of the 1000+ Australian estuaries as part of the National Land and Water Resources Audit. The estuary project was divided into three components, 1) a concept mapping and initial assessment of each estuary (summarized in the book "Where River Meets Sea:
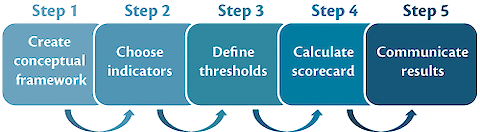
PART 6; Five step program for environmental report cards … Several basic steps are involved in producing report cards. Let me go through five steps of generating Report Cards that we've generated. And they are relatively simple and straightforward. First is to draw it, to create the conceptual framework. Second, is to choose the indicators. Third is to define the thresholds. Fourth is to calculate a scorecard. And fifth and most importantly, communicate it.
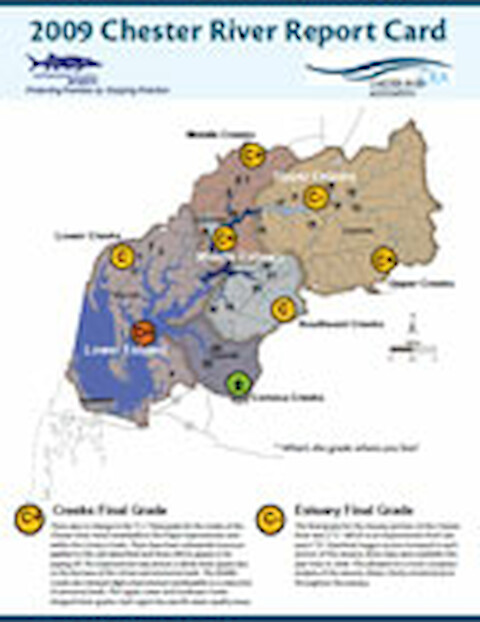
PART 5; Report card examples … Another aspect that I think has a lot of similarities to Ontario right now with your thirty-six conservational authorities doing these Report Cards, is that first in some areas where you don't have a lot of resources, that citizens and scientists become a really powerful tool. And we've developed a coalition around these citizen and scientist groups. An example is the Chester River, and citizen science group call themselves the Chester Testers.
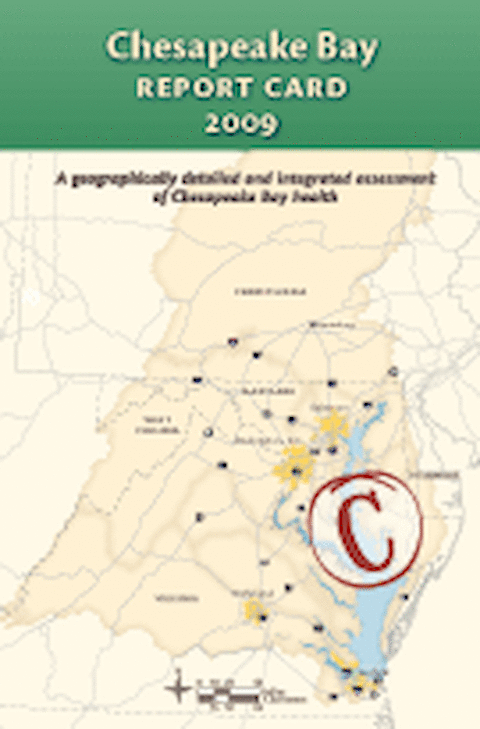
PART 4; Environmental Report Cards … Let me talk about one science communication tool that we've been developing, that we think is really powerful, and this is the Environmental Report Card. They're really powerful for three big reasons. One is they are a really good peer pressure motivator, because peer pressure motivates human change. The story I'll give here is the Chesapeake Bay Report Card.
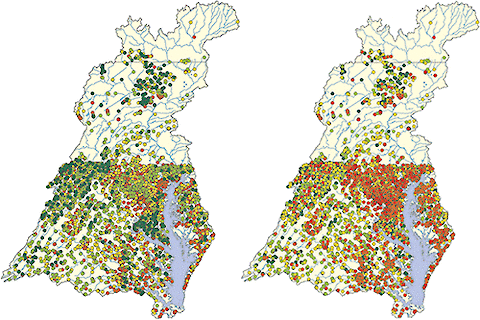
In order to create a map of stream health in the Chesapeake watershed, Katie Foreman, Scott Phillips, Claire Buchanan and colleagues in the Non Tidal Workgroup of the Chesapeake Bay Program generated a data set of benthic macroinvertebrate condition using data collected by state agencies in the Chesapeake watershed. The original map created by Katie and her team in 2009 had approximately 3,200 data points, distributed throughout the watershed.
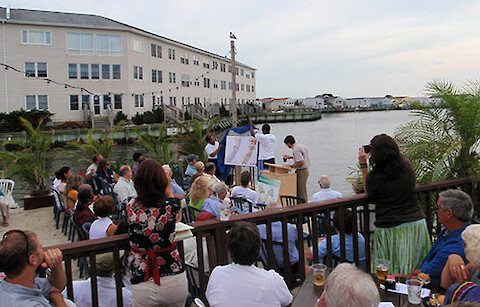
The Maryland Coastal Bays Program report card was released at an interesting venue in Ocean City in late afternoon, June 30. Macky's Barside & Grill on 54th Street in Ocean City provided a bayside venue for the release with perfect weather. Jet skis and motorboats were buzzing in and out of the canal, a roosting colony of laughing gulls in the marsh and the babble of dinner guests eating in the sandy beach provided a lively backdrop to the proceedings.
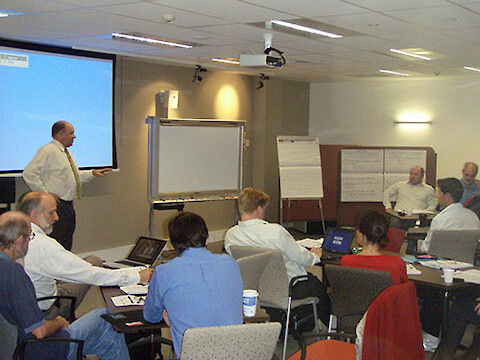
On May 25-26, a workshop was convened in Brisbane, Australia to develop a strategy to create a 'paddock to reef' environmental report card for the Great Barrier Reef. The Queensland Department of Premier and Cabinet organized the workshop and IAN staff served as facilitators, Bill Dennison, Heath Kelsey and Jane Thomas.
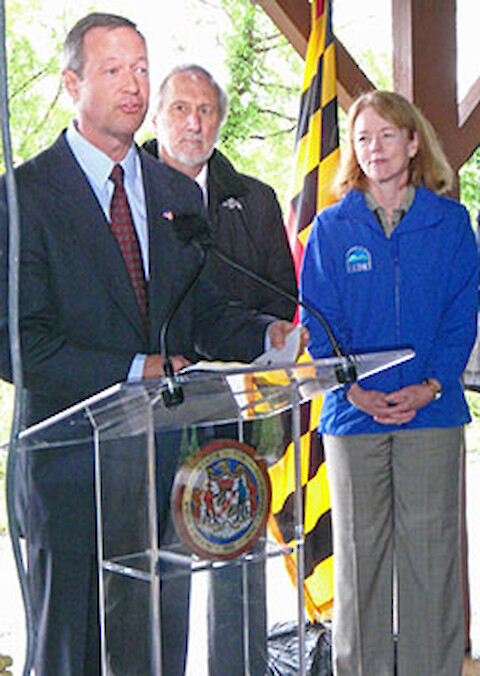
The 2009 Chesapeake Bay report card release was held at Gunpowder Falls State Park in Baltimore City on May 18. It was a cold rainy day, and the intrepid folks who braved the weather huddled under a pavilion waiting for Maryland Governor Martin O'Malley. This is the first time that the Chesapeake Bay report card produced by the EcoCheck team, a partnership program between NOAA and the University of Maryland Center for Environmental Science (UMCES), was released with elected officials.