

Conceptual Diagramming with the Integration and Application Network
Bill Dennison · | Environmental Report Cards | Science Communication |Anthony Kung wrote an interesting blog entitled “Conceptual diagrams or conceptual diagramming? Creating diagrams as a tool for stakeholder collaboration” which was posted on the Newsdrop enewsletter of the International Water Centre. Anthony recently spent 8 months embedded at the University of Queensland. His insights into the conceptual diagramming process were both thoughtful and thought-provoking. This blog was developed as an outcome of a discussion that Heath Kelsey, Suzi Spitzer, Vanessa Vargas and I had about Anthony’s blog.
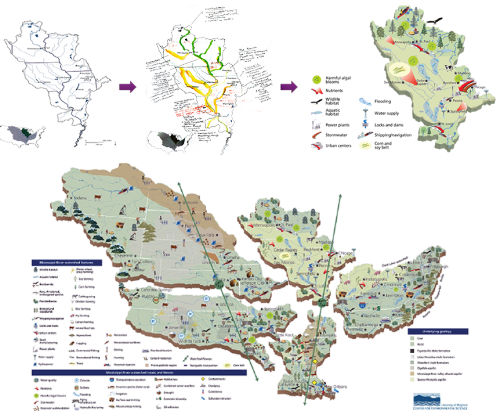
Conceptual diagramming for the Mississippi River Report Card, from hand-drawn maps to illustrations.
Anthony draws a distinction between producing a product (conceptual diagram) and the process of producing the product (conceptual diagramming). This distinction fits into our mantra at IAN: “The product drives the collaborative process”. Anthony analyzed the process of creating conceptual diagrams that we developed as part of the production of environmental report cards for Long Island Sound and the Mississippi River watershed. We also produce conceptual diagrams for a variety of other science communication uses, including proposals, scientific syntheses, management publications. We employ a similar collaborative process to generate these conceptual diagrams, but for different purposes than the report card process. A diverse set of examples can be found in a previous blog, “Top ten conceptual diagrams: Seagrasses, streams, eco-rhythms”. One of the strengths of using conceptual diagrams is the ability to depict historical situations and provide a vision for various future scenarios (see “The Changing North Woods and Moose” IAN newsletter).

We are beginning to see conceptual diagrams as analog models, in contrast to conceptual models and their associated simulation models as digital models. Both analog and digital versions have their strengths, and a combination of the two is something that we at IAN have long desired. Using a simulation model to create quantitative outputs that are depicted using an animated conceptual diagram would be a powerful way of communicating model outputs.
In the report card setting of developing conceptual diagrams that Anthony observed, the audience and context had already been determined. On a broader scale, we find that developing the context and audience for the conceptual diagram is very important. Establishing links to the knowledge that supports the assertions that are made in a conceptual diagram can be important. In scientific journals, citations in peer review literature are required, for example. Anthony mentions the socio-political context* of conceptual diagrams, and we heartily agree. The process of creating conceptual diagrams is something that we document (e.g., workshop newsletters and blogs). The credibility of the participants and their respective organizations is also important and we list them as well. Building trust among stakeholders during the conceptual diagramming process is important, and something we strive for in workshops. Developing trust in the role of IAN personnel as outside consultants hinges on our ability to listen to stakeholders and depict their issues effectively in the conceptual diagrams that we produce with them.
 led the activity (top photo).")
Anthony lists the following advantages of using conceptual diagrams: no artistic skills needed, helps organize chaotic situation, overall understanding of stakeholders improved, and can be used throughout participatory planning process. In addition, we believe that the online IAN symbol libraries has made it easier to generate attractive, useful and accurate diagrams. Anthony also lists the following disadvantages: challenging to represent everything visually, complex, time-consuming revisions are needed, difficult to incorporate all elements and stakeholders. We agree with the importance of complex, time-consuming revisions, but have found that it is often in the give and take of articulating recommended revisions and the response to the recommendations that forms a deeply collaborative process. However, we have also found that excessive revisions can distract from the overall goal. We also consider diagrams as only one of the different types of visual elements that can be used to communicate science. Maps, photographs, tables and figures are other visual elements that can be employed for science communication, and for some purposes, can be more effective than conceptual diagrams.
We have found that conceptual diagrams are a useful way to prioritize what is important about the subject matter. In addition, drawing a diagram crystallizes what you really know vs. something that you don't understand well enough to draw: "If you can't draw it, you don't understand it". Diagrams can be used to tell a story, just as words can be used to tell a story. Symbols can be equated to words in a story and assembling these symbols into a diagram is akin to assembling words to tell a story. Story-telling is an important part of effective communication, thus conceptual diagrams that tell a story are particularly useful.

In the process of diagramming, we use quick sketches on whiteboards, electronic tablets or large sheets of paper. The key is to not get hung up on accuracy or artistic quality, rather focus on representations that can be used to create high quality diagrams using software at a later date. Anthony includes the observation that a technique used by IAN facilitators is to strive for the workshop participants to have fun. We absolutely concur and we contend that the act of drawing conceptual diagrams is a fun, creative activity in and of itself.
Anthony observed that the IAN facilitators came to workshops prepared with background knowledge about the subject matter and an initial sense of the geography. We do indeed scour the scientific as well as gray literature for background material and spend time with google earth familiarizing ourselves with the region. In many cases, IAN Science Communicators will have already prepared base maps, land use maps, and even mocked up a workshop newsletter prior to the workshop to facilitate rapid turnaround. We often equate this to a cooking show, where the chef goes through the steps in preparing a dish, but then reaches into the oven to pull out a completed version, prepared beforehand. While we do not have all of the ingredients prior to the workshop to complete the product, we do assemble as many ingredients as possible beforehand.

One of the links that Anthony provided in his blog was to "rich pictures". Rich pictures were defined as "Pictorial representations of environmental or social systems that include relevant elements and stakeholders". This fits the definition of conceptual diagrams hat IAN employs. Rich pictures incorporate 1) structure, 2) process and 3) concerns. In developing conceptual diagrams, we focus on a) key features (structure and function) and b) major threats (concerns). Note that we use the modifiers "key" and "major" to promote the concept of prioritization rather than trying to incorporate everything. Using rich pictures to both refine an individual's perspective as well as to integrate perspectives into one rich picture is a good way to view conceptual diagraming. One aspect that the discussion of rich pictures described was using "thought bubbles" to depict stakeholder concerns or views, which is an idea that we found intriguing and may incorporate in future IAN diagrams.
We consider conceptual diagrams to be foundational in two aspects of developing a participatory process. One aspect is the creation of a common vision depicted in a conceptual diagram. Establishing this visualization provides a central organizing theme for a project. The other foundational aspect is to solicit and incorporate input from all stakeholders for a participatory process to generate a conceptual diagram. Creating a conceptual diagram is a microcosm of the overall participatory process of creating the final product(s). Conceptual diagrams can be a central organizing feature of the final product (e.g., Great Barrier Reef report card; Willamette River report card) or can be supporting material (e.g., Chesapeake Bay report card; Long Island Sound report card). Either way, conceptual diagrams serve a critical role in communicating a story about a place to the stakeholders.

Anthony did IAN a fantastic service in shining a light on our approach and process and stimulating us to look within ourselves to learn how and why we do what we do. For this we are grateful, and we eagerly await his dissertation to continue to provoke us into reflection and analysis.
*Socio-political context: process of creation (workshops that are documented), credibility of participants (and the conceptual diagram authors), building trust among stakeholders and particularly with consultants
About the author
Bill Dennison

Dr. Bill Dennison is a Professor of Marine Science and Vice President for Science Application at the University of Maryland Center for Environmental Science.