IAN is committed to producing practical, user-centered communications that foster a better understanding of science and enable readers to pursue new opportunities in research, education, and environmental problem-solving. Our publications synthesize scientific findings using effective science communication techniques.
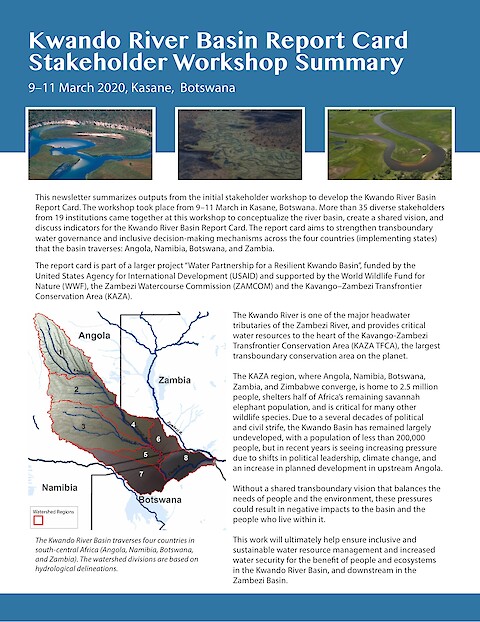
This newsletter summarizes outputs from the initial stakeholder workshop to develop the Kwando River Basin Report Card. The workshop took place from 9–11 March in Kasane, Botswana. More than 35 diverse stakeholders from 19 institutions came together at this workshop to conceptualize the river basin, create a shared vision, and discuss indicators for the Kwando River Basin Report Card.
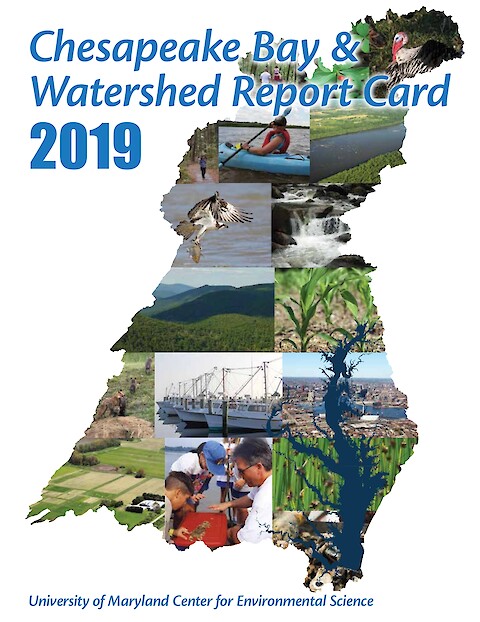
This report card provides a transparent, timely, and geographically detailed assessment of Chesapeake Bay. Since 2016, UMCES has engaged stakeholders throughout the watershed to transform the report card into an evaluation of the Chesapeake Watershed health. Watershed health includes traditional ecosystem indicators, but also social, economic, and cultural indicators. This is the first year the watershed has been scored, using five indicators of ecological and socioeconomic health.
Erica Towle, Erick Geiger, Jay Grove, Sarah Groves, Shay Viehman, Matthew Johnson, Jeremiah Blondeau, Jennifer Stein, Matt Gorstein, Amanda Borque, Alejandro Acosta, Meaghan Johnson, Mike Feeley, Francisco Pagan, Lauri MacLaughlin, Kathryn Lohr, Caitlin Lustic, Karen Bohnsack, Jim Bohnsack, Derek Manzello, Ian Enochs, Jennifer Koss, Kimberly Edwards, Peter Edwards, Andy Bruckner, Sara Thanner, Jennifer Herbig, Kelly Montenero, Dana Wusinich-Mendez, Kurtis Gregg, Chris Kelble, Tom Moore, Leanne Rutten, Philip Kramer, Pat Quinn, Erick Ault, Jerald Ault, Sarah Fangman, Chloe Fleming, David Gilliam, Kirk Kilfoyle, Brian Walker, Diego Lirman. ·
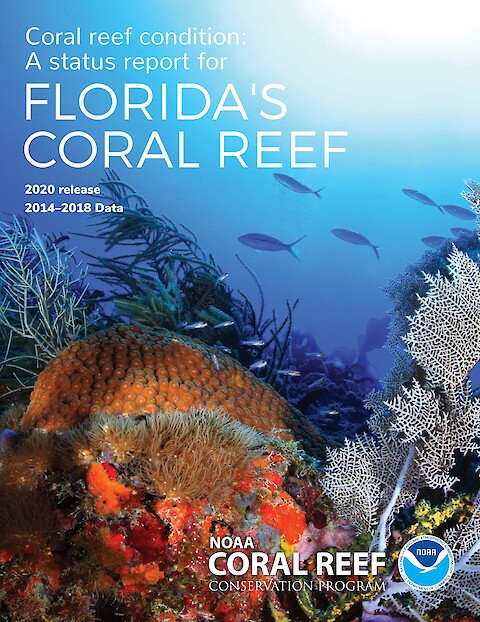
Effective coral reef conservation cannot be accomplished without an informed and engaged public. This status report is part of an ongoing series of documents to track the status and trends of coral reefs across the U.S. and its territories. Florida's Coral Reef status report is part of a larger effort to provide the public and decision-makers with information about managing and conserving coral reef ecosystems.
Antares Alvarez, Eileen Alicea, Helena Antoun, Jeremiah
Blondeau, Ernesto Diaz, Caroline Donovan, Kimberly
Edwards, Peter Edwards, Ian Enochs, Tania Metz Estrella,
Chloe Fleming, Nate Formel, Reni Garcia, Erick Geiger,
Matt Gorstein, Melissa Gonzalez, Sean Griffin, Jay Grove,
Sarah Groves, Miguel Figuerola Hernandez, Matthew
Johnson, Chris Jeffrey, Aurora Justiniano-Santos, Heath
Kelsey, Nilda Jimenez Marrero, Derek Manzello, Nathan
Miller, Michael Nemeth, Hector Ruiz, Jorge Sabater, Erica
Towle, Orian Tzadik, Michelle Schärer-Umpierre, Shay
Viehman, Ernesto Weil, and Stacey Williams. ·
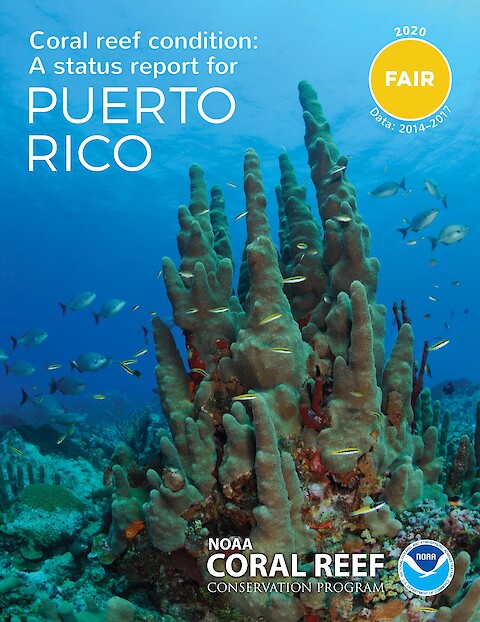
Effective coral reef conservation cannot be accomplished without an informed and engaged public. This status report is part of an ongoing series to track the status and trends of coral reefs across the U.S. and its territories. The Puerto Rico coral reef status report is part of a larger effort to provide communities and decision-makers with information about managing and conserving coral reef ecosystems.
This status report is a joint product of NOAA's Coral
Reef Conservation Program (CRCP), Flower Garden
Banks National Marine Sanctuary, and the University of
Maryland Center for Environmental Science. Science
communication, design, and layout by Nathan Miller,
Caroline Donovan, Heath Kelsey, Max Hermanson, and
Annie Carew. March 2020. ·
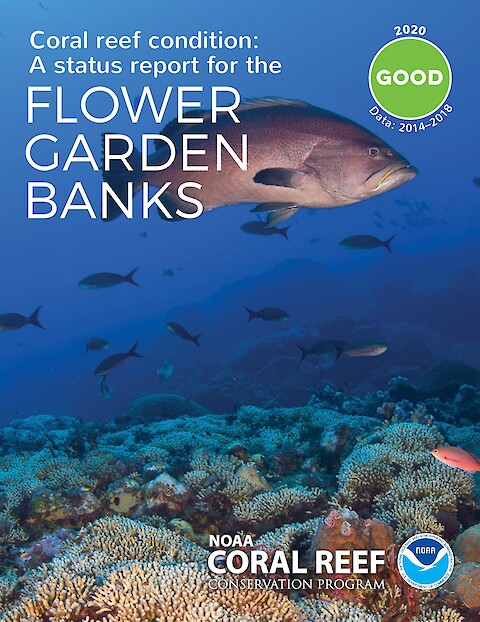
Effective coral reef conservation cannot be accomplished without an informed and engaged public. This status report is part of an ongoing series of documents to track the status and trends of coral reefs across the U.S. and its territories. The Flower Garden Banks coral reef status report is part of a larger effort to provide the public and decision-makers with information that helps us manage and conserve coral reef ecosystems.
Jeremiah Blondeau, Marilyn Brandt,
Mark Eakin, Kimberly Edwards, Kitty Edwards, Peter
Edwards, Ian Enochs, Mike Feeley, Chloe Fleming, Nate
Formel, Erick Geiger, Matt Gorstein, Jay Grove, Sarah
Groves, Leslie Henderson, Marlon Hibbert, Nathaniel
Holloway, Matt Johnson, Thomas Kelley, Heath Kelsey,
Jennifer Koss, Derek Manzello, Caroline
Pott, Tyler Smith, Erica Towle, Shay Viehman. ·
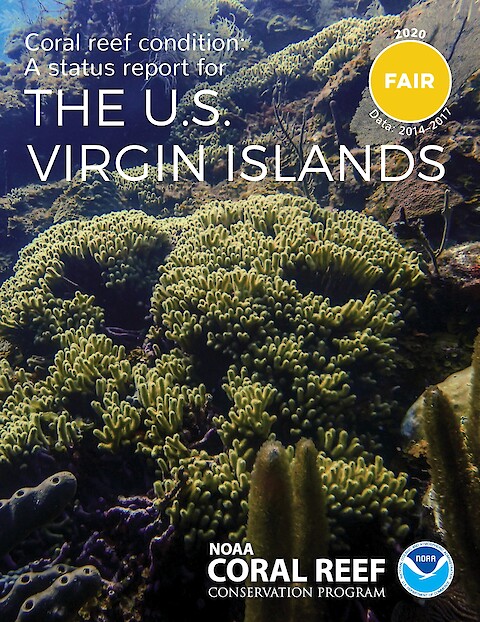
Effective coral reef conservation cannot be accomplished without an informed and engaged public. This status report is part of an ongoing series of documents to track the status and trends of coral reefs across the U.S. and its territories. The USVI coral status report is part of a larger effort to provide the public and decision-makers with information about managing and conserving coral reef ecosystems.
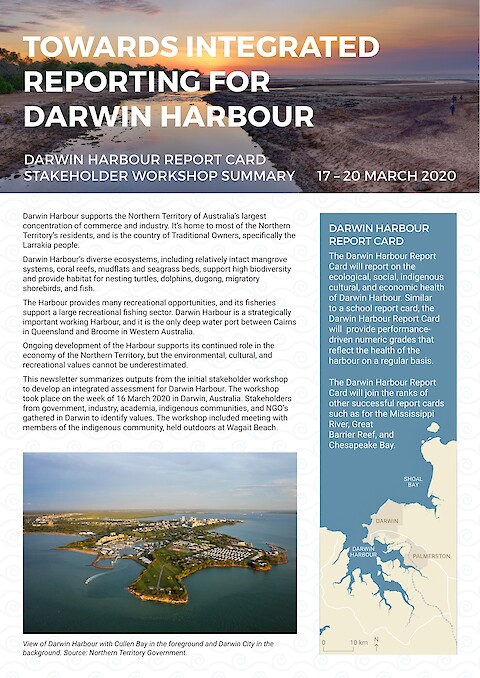
This newsletter summarizes outputs from the initial stakeholder workshop to develop an integrated assessment for Darwin Harbour. The workshop took place on the week of 16 March 2020 in Darwin, Australia. Stakeholders from government, industry, academia, indigenous communities, and NGO’s gathered in Darwin to identify values. The workshop included meeting with members of the indigenous community, held outdoors at Wagait Beach.
Nuno Simões, Jennifer Pollack, Fernando Bretos TOF, Erica K. Towle NOAA, Shay Viehman, Matthew
Johnson, Joaquín Rodrigo Garza Pérez, Armando Carmona, Lorenzo Álvarez Filip, Horacio Pérez España, Cristobal Cáceres G. Cantón C, Luis Quijano, Alfonso Aguilar Perera, Melania López Castro, A.C., Eduardo Amir Cuevas, Enrique Montes Herrera, Julia Azanza Ricardo, Gustavo Arencibia, Patricia González-Díaz, Dorka Cobián Rojas, Juliett González Méndez, Andrea Rivera Sosa, Luis Alcántara Organizing team, Ulsía Urrea Mariño, Ixel Osorio, Alberto Guerra, Daniel Martínez Hernandez ·
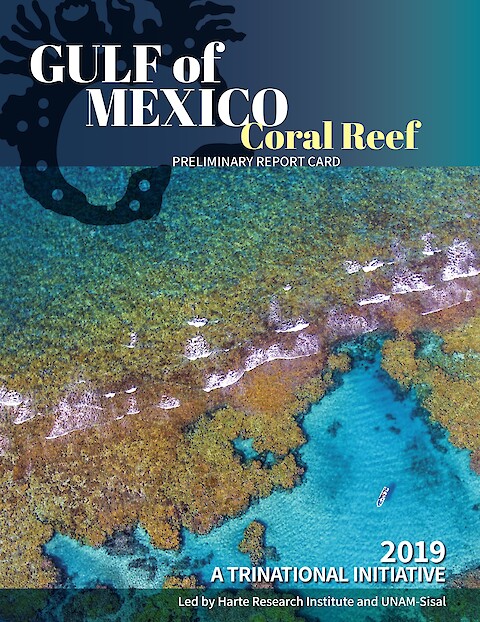
The Gulf of Mexico is one of the most diverse and productive ecosystems in the world. Its coral reefs are biological diverse habitats, of high cultural and economic significance. This report card was developed during a workshop held in Merida, Yucatan in November, 2019. It outlines potential indicators of coral reef ecosystem health, perceived conditions of the reefs in the Gulf of Mexico, and next steps for developing a quantitative assessment of Gulf of Mexico coral reef ecosystems.
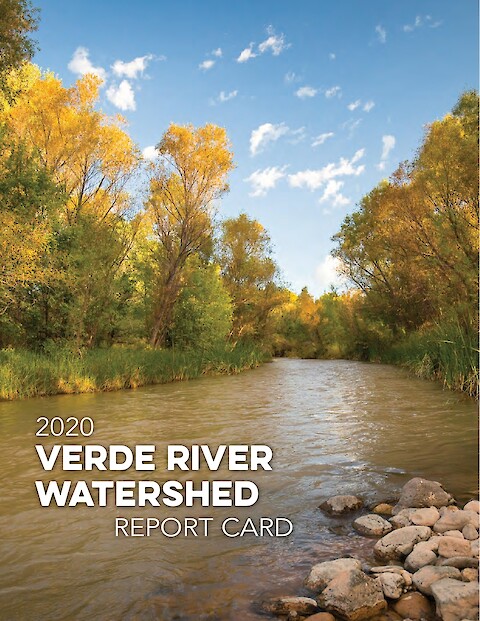
Watershed report cards are powerful tools to describe ecosystem status, increase public awareness, and inform and influence decision makers to improve the health of a watershed. This is the first Verde River Watershed Report Card. It is the collective effort of dozens of stakeholders throughout the Verde watershed. Indicators in the report card were selected to assess the health of three different values in the Verde watershed: Water, Habitat, and Communities.
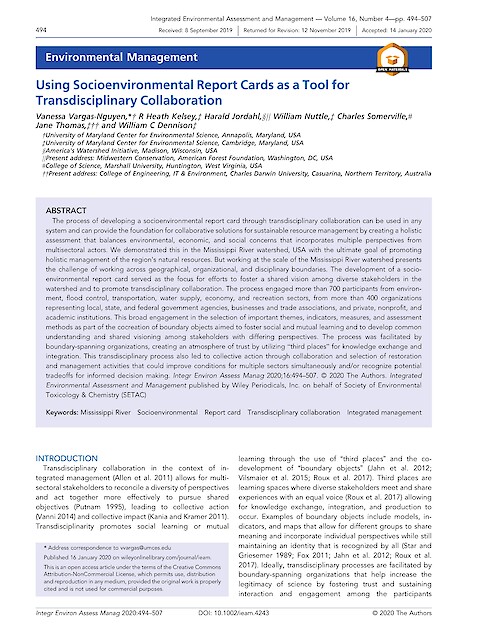
The process of developing a socioenvironmental report card through transdisciplinary collaboration can be used in any system and can provide the foundation for collaborative solutions for sustainable resource management by creating a holistic assessment that balances environmental, economic, and social concerns that incorporates multiple perspectives from multisectoral actors.


 ' data-adaptive-image-max-img='
 '>
'>