Blog posts for the Science Visualization course

Learn how to storyboard your next visualization publication

Anna Windle ·
21 April 2020
   1 comments

What comes to mind when you think of storyboarding? Maybe you think of a film storyboard that uses a series of ordered images and directions to visually outline a plot or story. Figure 1. 1953 storyboard of Disney's Peter Pan. Source: Digital Media Academy … Or maybe your mind goes to a comic book or strip where a story can be visualized through a sequence of illustrations and text. Figure 2. Sherman's Lagoon comic strip. Source:

Read more

Developing a Focus - A Guide to Practical Photography/Videography

Madeline (Maddy) Lahm ·
4 April 2020

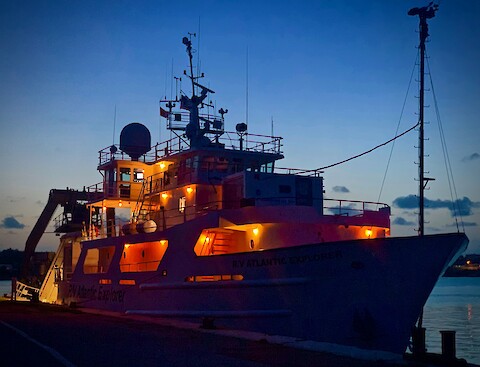
A great photograph of your research or fieldwork can make all the difference in your presentation, publication, or on your poster. Not only can it help convey complex ideas, but it can draw attention and focus from the audience, set the scene and tone of the discussion, and use aesthetics to make people think you know what you're doing - like this one: Figure 1. R/V Atlantic Explorer, St. George's, Bermuda.

Read more

The message behind scientific figures

Taylor Armstrong ·
10 March 2020
   1 comments

Scientific figures come in many forms and can be perceived differently depending on how data is displayed. Taylor Armstrong, a student in the Science Visualization course at UMCES, discusses the importance of communicating data clearly to your audience.

Read more

Let your data speak! Less is more…

Srishti Vishwakarma ·
2 March 2020
   1 comments

Feel like your research graphs and figures are boring or difficult for others to understand? Srishti Vishwakarma, a student in the Science Visualization course at UMCES, details how to liven up data visuals in this blog post.

Read more